| Table of Contents | ||
|---|---|---|
|
...
The Y-axis displays count of logged Issues and count of Executed Test Cases.
Archived records will be excluded from the report.
Users can drill down the chart to view details in tabular format.
...
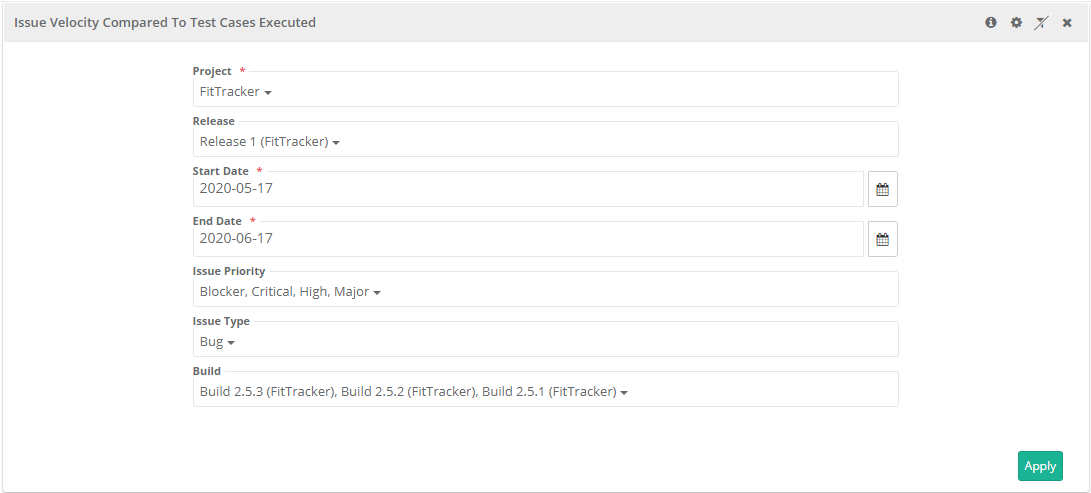
Filter Report:
Click on the Filter icon  on the individual chart to generate the report as per requirement by applying multiple filters.

Issue Velocity compared to Requirements
...