| Table of Contents |
|---|
Introduction
Analytics provides a detailed view of execution results. Users can study and analyze the executions looking at the different statistics like Total Test Suites, Total Test Cases, Total Passed, Total Failed, Total Skipped, and Total Duration of the test run.
QAS Reports are available under the Analytics menu.
...
Test Recorder Report: It displays execution reports for the execution carried out through test recorder for web and mobile web.
Command Line Report
...
displays execution reports generated through terminal/command line executions.
...
Users can drill down to the details of individual test suites to get details of Environment and test cases.
...
If both integrations present in QAS, then priority will be given to QMetry Test Management and issues will be logged into it.
| Table of Contents |
|---|
Test Recorder Report
Users can view the report of test suite execution carried out through the Test Recorder section of QAS. Users can upload test results report directly to QTM/QTM4J.
Execute Test Cases
Refer to Execute Test Cases and Test Suites for more details.
View Test Recorder Report
Steps:
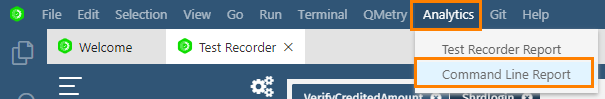
Open the Analytics menu on the menu bar.
Select Test Recorder Report.
...
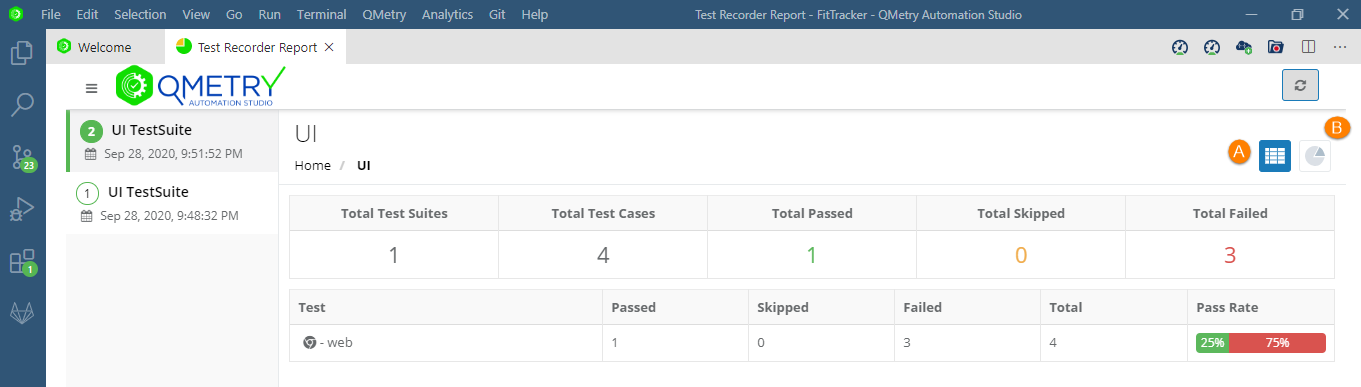
The Test Recorder Report opens.
The report can be viewed in: A. Tabular View or B. Graphical View.
A. Tabular View
The Summary view of report displays count of test suites, test cases and execution statistics. Click on the Test to view more details for the test suite.
...
The report displays Environment and test details of the test suite that has been executed.
Expand the Environment Information pane to view details about Execution System, Framework version, Desired Capabilities, Actual Capabilities, Run Parameters.
Click on the failed test to view its detail and analyze the problem.
Expand the test case pane to view details of Check Points, Step Time Analysis and Details.
You can apply filter on - test case execution status, Configuration and Test to view desired details in the report.
Analyze Failed Executions
Check Points
Open the Check Points tab to view the check points of the failed test.
You can verify the operation that is performed during the test.
...
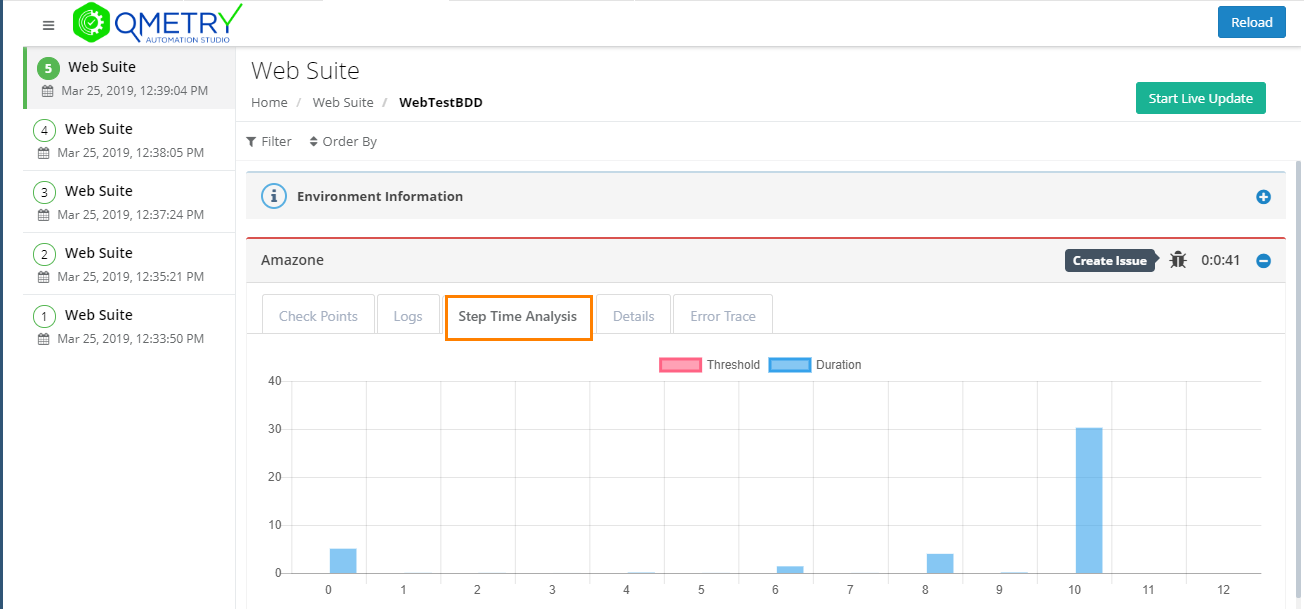
Step Time Analysis
The graph in the tab displays execution time of each step in the test case.
The legends include Threshold and Duration.
Duration: It is duration time taken for executing a single test step.
Threshold: In QAF and Cucumber frameworks, users can specify threshold value to each step. It is like the acceptable defined limit. If the time of execution increases the threshold value, that step will be marked as per the legend. For example, "Login" step is set with threshold of 2 seconds. Now it takes 5 seconds for execution, then the “Login” step will be marked as Threshold.
...
Details
The tab displays test case details like - Author who wrote the test case, Description of test case, test case Reference path, Start Time when test case execution started, End Time when test case execution ended, and the actual execution time of the test case.
B. Graphical View
To view the graphical presentation of the report, click on the graph icon at top right.
...
Command Line Report
It displays execution reports generated through terminal/command line executions.
Execute Project
Note: In order to generate Test Reports, it is mandatory to execute the project from command line/Terminal (after Exporting test steps from test recorder).
Run the command according to the project language and project type.
For example,
Java type projects command is "mvn clean test"
Typescript/Javascript type projects command is "npm test"/"npm run test"
Steps:
1. Go to Terminal > New Terminal.
2. Run the command according to the project language and project type. The following is an example of Java type project. Hence, we are running 'mvn test' command here.
Once the project execution is completed, the test-results folder is created on the folder structure with specific date and time sub-folder in it. The sub-folder denotes date and time (as per UTC timezone) of report generation.
A new sub-folder will be created every time you run the maven command to execute the project.
...
View Command Line Reports
Steps:
Open the Analytics menu on the menu bar.
Select Test Recorder Report.
...
Expand the test case pane to view details of Check Points, Logs, Step Time Analysis, Details and Error Trace.
Analyze Failed Executions
Check Points
Open the Check Points tab to view the check points of the failed test.
...
Open the tab to view the logs recorded for the test cases to study the execution of each method, their individual results, and execution time of each method. The logs help users in digging more granular details related to the test case execution.
...
Step Time Analysis
The graph in the tab displays execution time of each step in the test case.
...
Duration: It is duration time taken for executing a single test step.
Threshold: In QAF and Cucumber frameworks, users can specify threshold value to each step. It is like the acceptable defined limit. If the time of execution increases the threshold value, that step will be marked as per the legend. For example, "Login" step is set with threshold of 2 seconds. Now it takes 5 seconds for execution, then the “Login” step will be marked as Threshold.
Details
The tab displays test case details like - Author who wrote the test case, Description of test case, test case Reference path, Start Time when test case execution started, End Time when test case execution ended, and the actual execution time of the test case.
...