| Table of Contents | ||
|---|---|---|
|
...
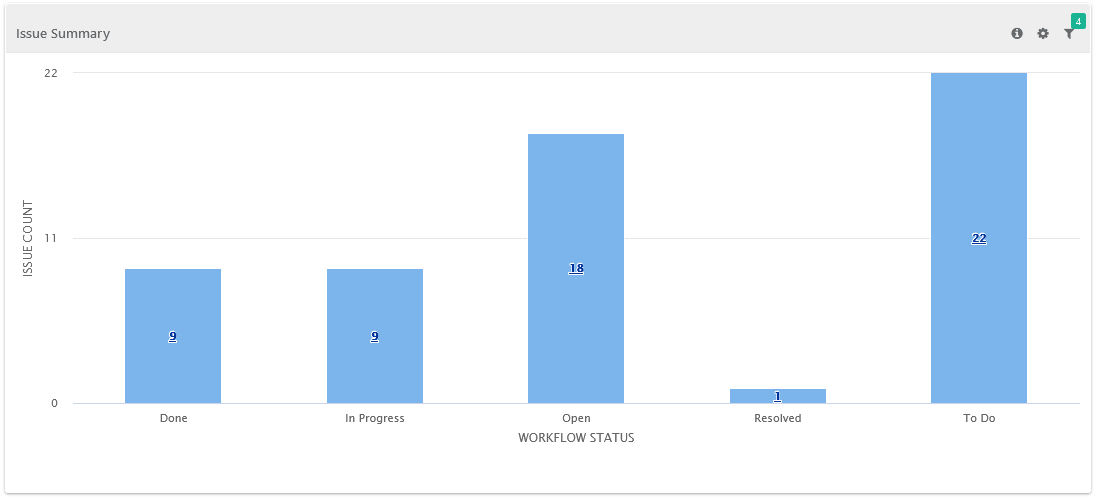
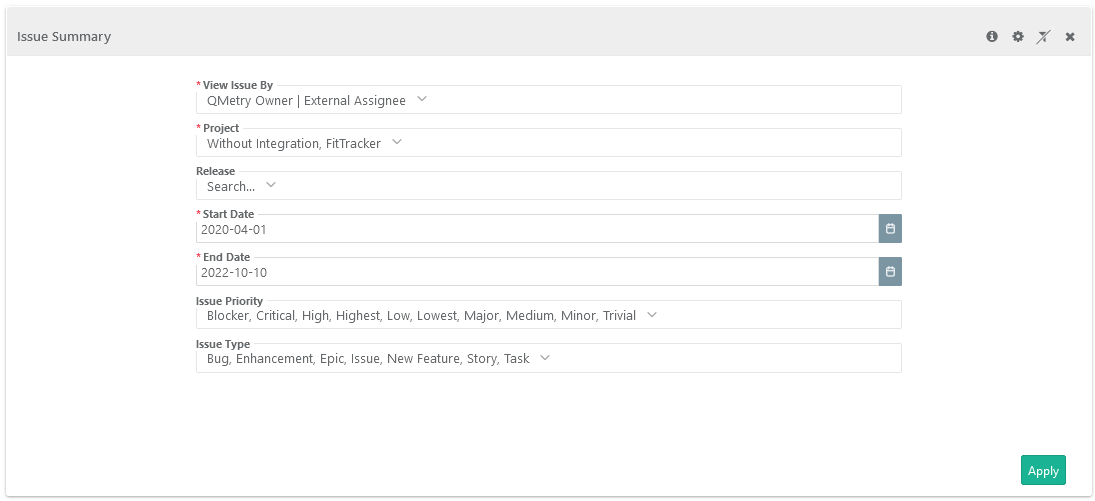
Issue Summary by Workflow Status

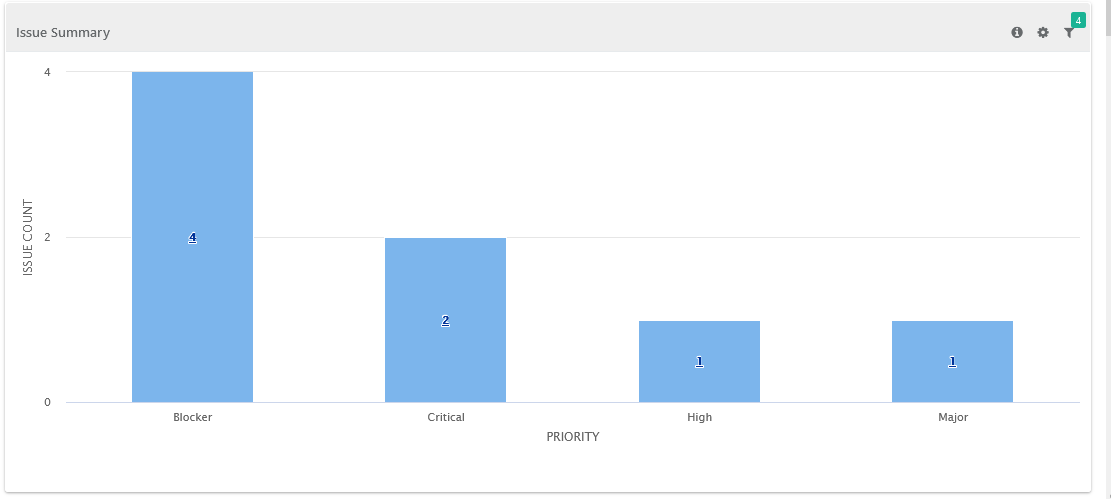
Issue Summary by Priority

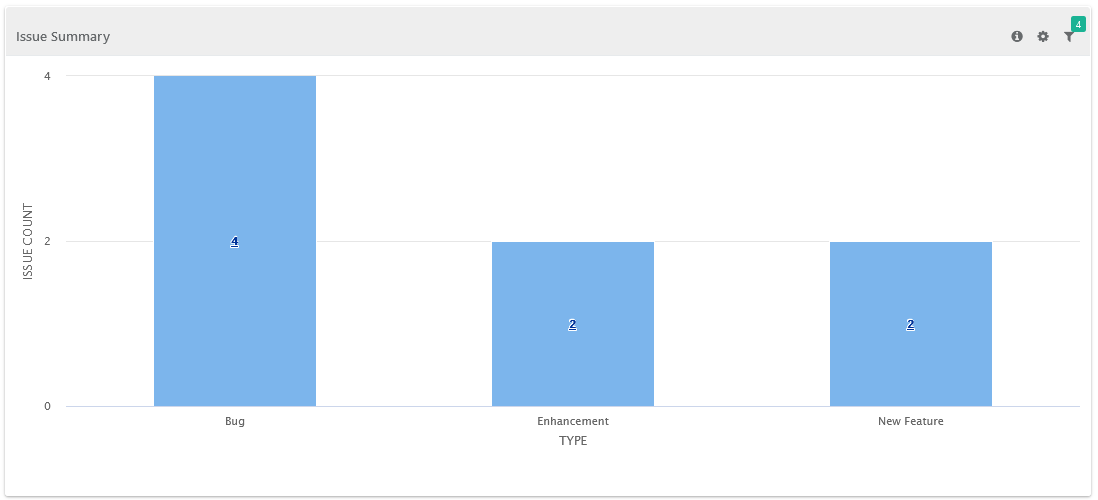
Issue Summary by Type

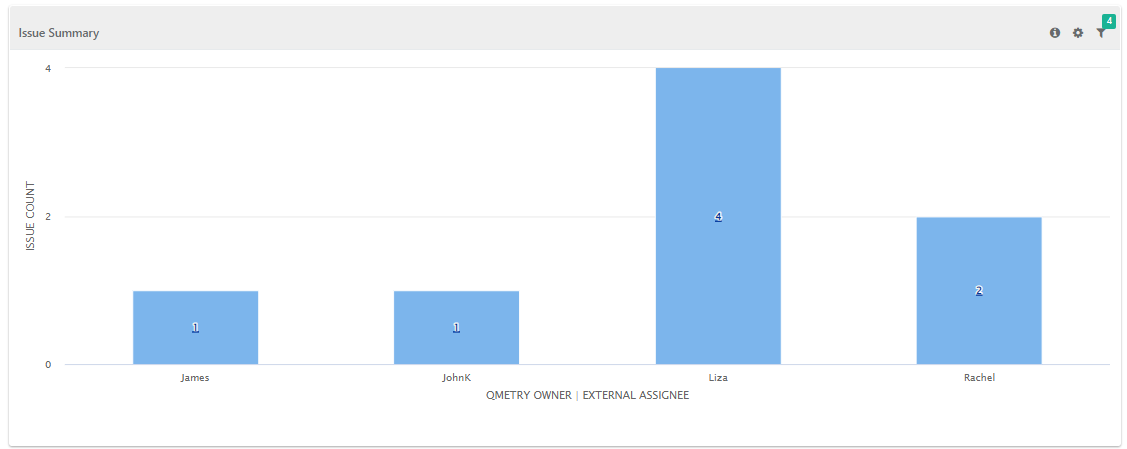
Issue Summary by QMetry Owner/External Assignee

Filter Report:
Click on the Filter icon  on the individual chart to generate the report as per requirement by applying multiple filters.

Issue Count by Status & Priority
As the name suggests, the report gives count of issues bu by Status and Priority assigned to them. The legends are provided below the graph.
...
Users can drill down the chart to view details in tabular format.
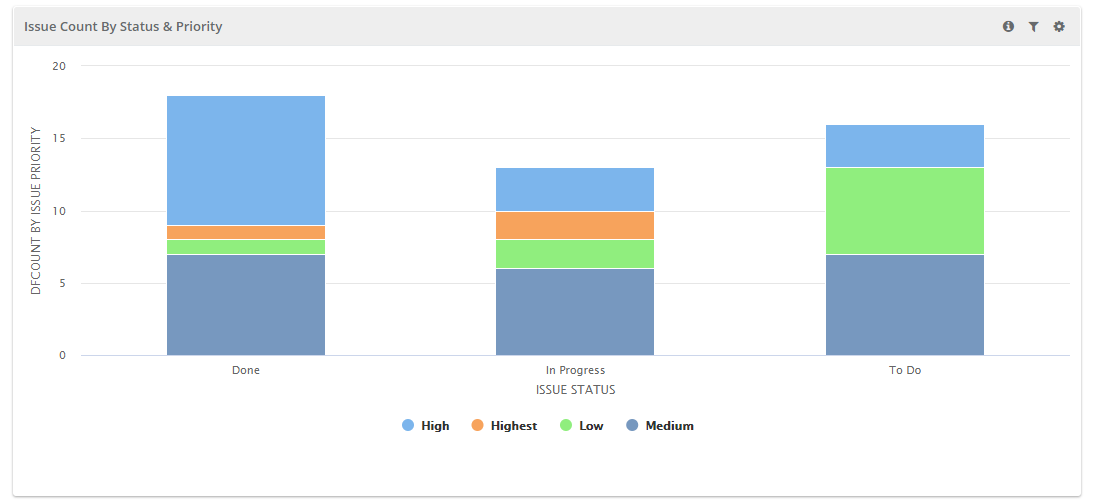
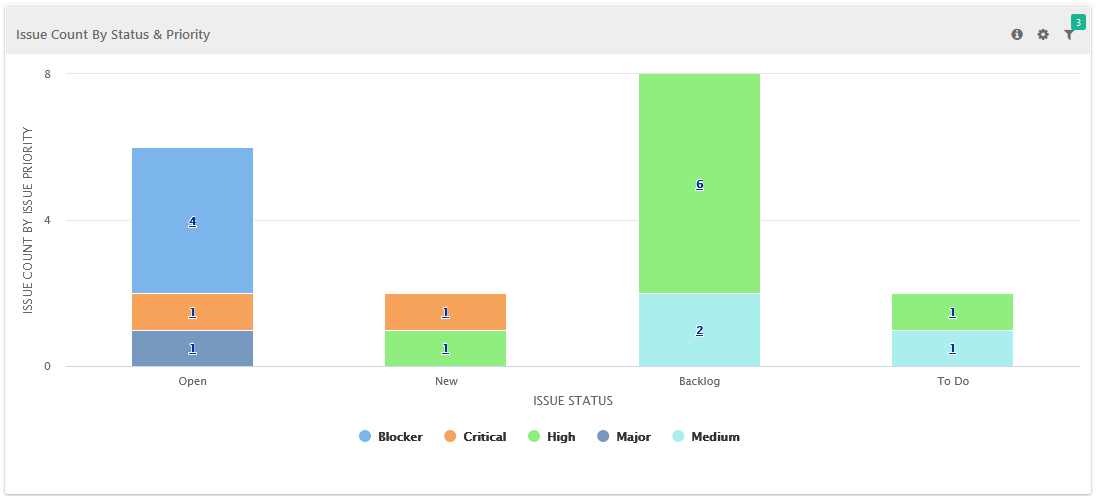
Filter Report:
Click on the Filter icon on the individual chart to generate the report as per requirement by applying multiple filters.
...
The Y-axis displays count of logged Issues and count of Executed Test Cases.
Archived records will be excluded from the report.
Users can drill down the chart to view details in tabular format.
...
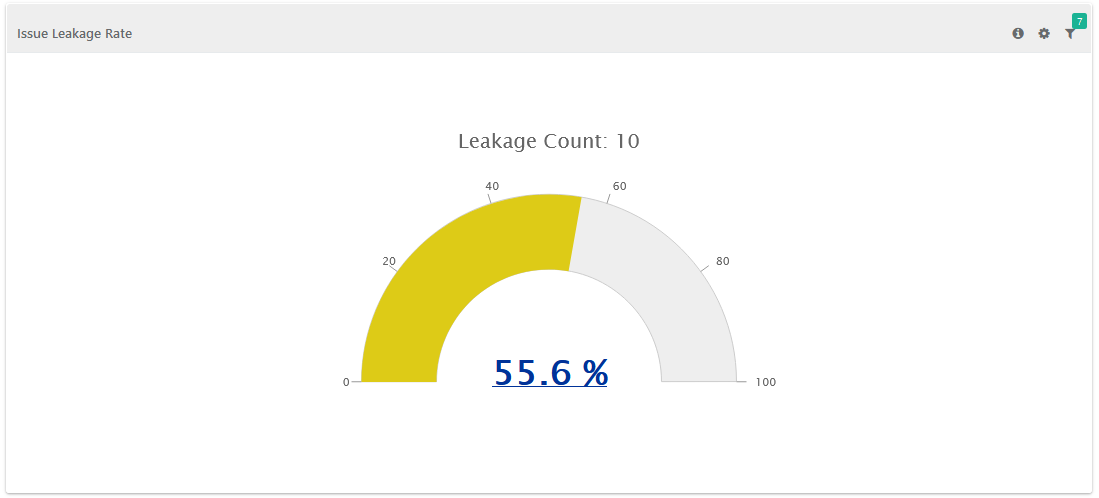
Number of Issues found during next phase / (Number of Issues found during testing + Number of Issues found during next phase) * 100
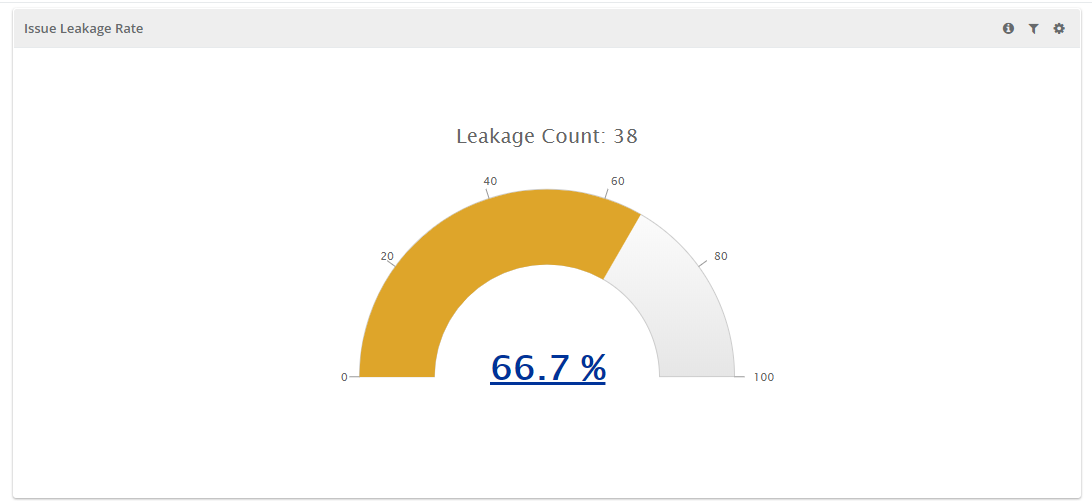
Filter Report:
Click on the Filter icon on the individual chart to generate the report as per requirement by applying multiple filters.
...