| Table of Contents |
|---|
Introduction
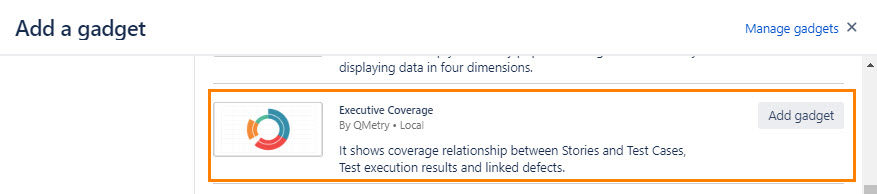
The Executive Coverage Report shows coverage relationship between Stories and Test Cases, Test execution results and linked defects.
For the selected Project, the report shows what percent of issues have one or more test cases associated. The report displays test coverage as well as overall testing quality. The coverage data is based on the stories you selected.
The report consists of three charts: Story Coverage, Test Run Coverage of selected stories and Defect Coverage of selected stories. Select Stories based on your release scope.
You can now add this report to your dashboard as gadget.
Before generating gadgets, save Filters in Jira as described in Test Run Summary Gadget > Filters.
Go to Dashboard and click on the Add Gadget button.
Select Executive Coverage to add as a gadget on your dashboard.
Story Coverage
Select Filter and select Story Coverage view. Set Gadget Title, if you want a customized one. Or leave the field blank to use default title.
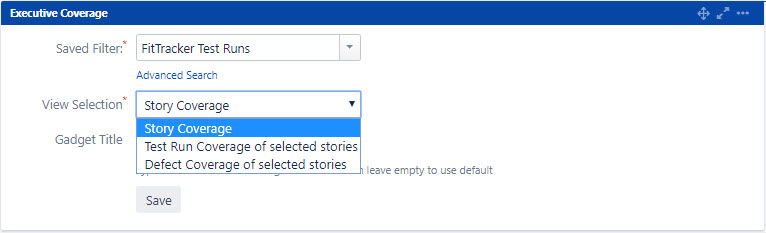
Click Save.
A pie chart is generated displaying Story Coverage based on test cases within the selected stories. It provides details of stories bifurcated on the basis of types of test cases within it.
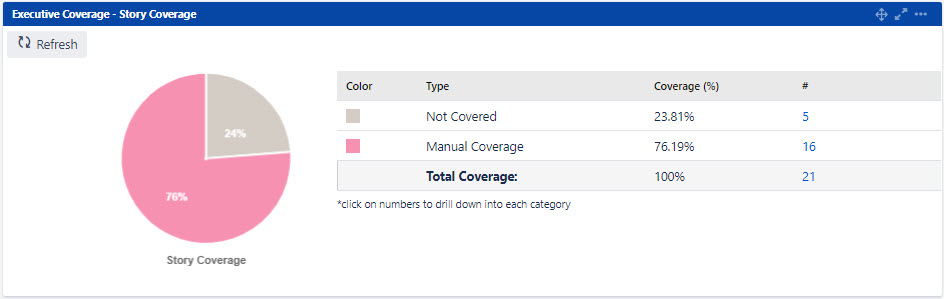
Not Covered: It refers to Stories which don’t have any test case within it.
...
It is a bar-stack chart, which displays Priority and Status wise count of defects logged during the test runs. Once you select test runs as described above, you can view the Defect of selected Test Run report.


The counts in the table are clickable. You can drill down each combination of Priority and Status, and view contents of the defects (bugs) covered in the test run.

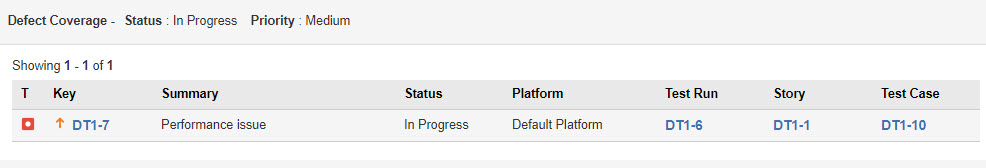
You can view the complete hierarchy of association –> Bug – Test Run – Story – Test Case.
...