The report shows the hierarchy of issues (Project -> Story -> Test Run -> Test Scenario ->Action Step -> Step Unit -> Defect) created over a period of time, Sprint or Version for a project/filter.
Click on any circle/node to expand/contract the hierarchy. Click on the issue key to go to the issue page.
You can refine the chart by Sprint, Version, Component, and Label.

A. Time Scale
You can generate the report for different time scale:
(a) Time frame
Time frame | The report is generated on calculation of the data that existed during – |
|---|---|
| Past Week | past week from the current date |
| Past 2 Weeks | past two weeks from the current date |
| Past Month | past month from the current date |
| Past 3 Months | past three months from the current date |
| Past 6 Months | past six months from the current date |
- Custom: Use the calendar to select “From” and “To” dates to define the time to consider the data. The "Custom Dates" is enabled as soon as you select the Custom Timeframe.
(b) Custom Dates: Use the calendar to select the "From" and "To" dates.
B. Viewing Options
You can view the report as Chart or Table. Both views can be further filtered by Time, Sprint, Version, Component, and Label.
| Chart |
|---|
The report shows the hierarchy of issues (Project -> Story -> Test Run -> Test Scenario ->Action Step -> Step Unit -> Defect) created over a period of time, Sprint or Version for a project/filter.
Click on any circle/node to expand/contract the hierarchy. Click on the issue key to go to the issue page.

| Table |
|---|
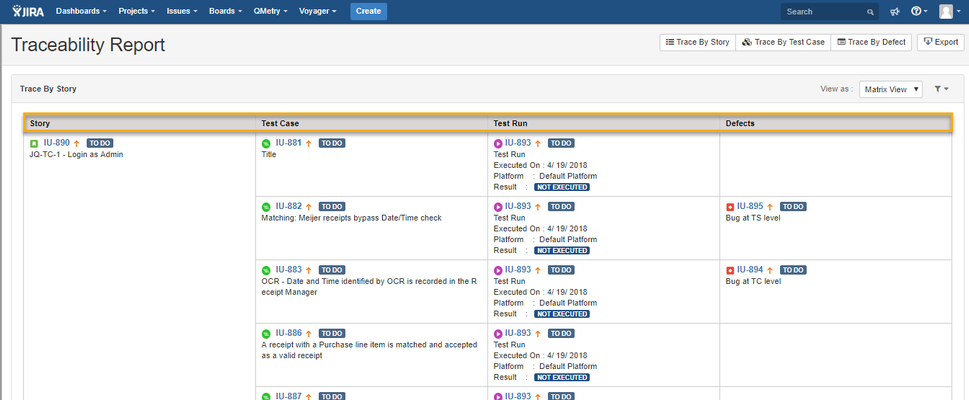
You can view the report in table format. Issue keys are clickable, which opens relevant issue in a separate page.

A. Trace by Story.
Select option Trace by Story, then select the Story.
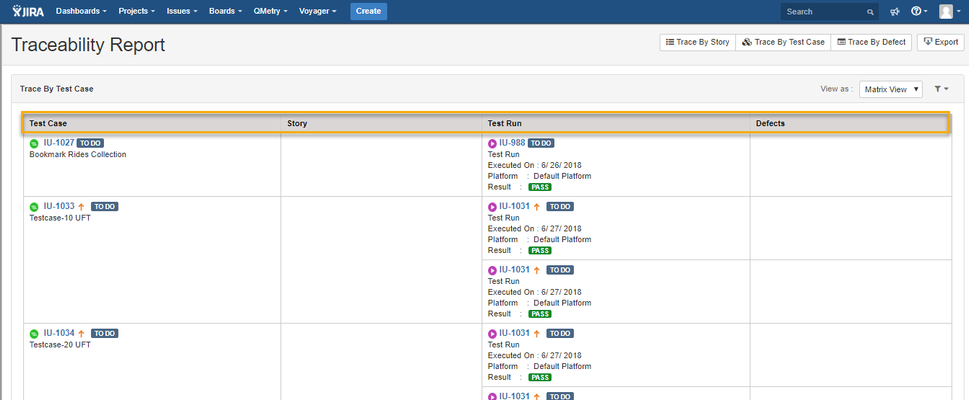
B. Trace by Test Case
Select option Trace by Test Case, then select the Test Case.
C. Trace by Defect
Select option Trace by Defects, then select the Defect(Bugs).
