...
QMetry Exploratory Testing helps users identify problems with the website/application under test. The Chrome Extension verifies the website through a browser to confirm that it is functioning properly.
The functionality traces actions performed during Exploratory UI testing in browser , and converts convert it into modular code that can be used for automated regression Tests.
Each event and navigation are recorded, which provides ready-to-use Automated Documentation.
The tool allows its users to log defects just on with a mouse click. It enables users to add visuals while logging defects, which makes it easy for the development team to catch the scenario where the application fails.
...
Project: Select the Jira Project in which session to be created.
Name: Enter the session name by which the test session will be identified.
Environment: Mention the Platform against which the is to be executed. By default, it will show the currently using OS and browser.
Tags: You can tag the session to categorize it. You can create multiple tags for a session.
Notes: Enter required notes or comments here in the text box.
...
Save Recording: Once you are done recording the session click on the Save Recording button to upload the session to QMetry for Jira.
Cancel Recording: If you want to cancel the session recording, click on the Cancel Recording button. If a bug is logged before cancelling canceling the recording, it will be added to Jira same as Logging Bug without Session.
...
It displays the stopwatch. Click on the Stop button to stop the audio recording.
To cancel the audio recording, click on the Discard button.
...
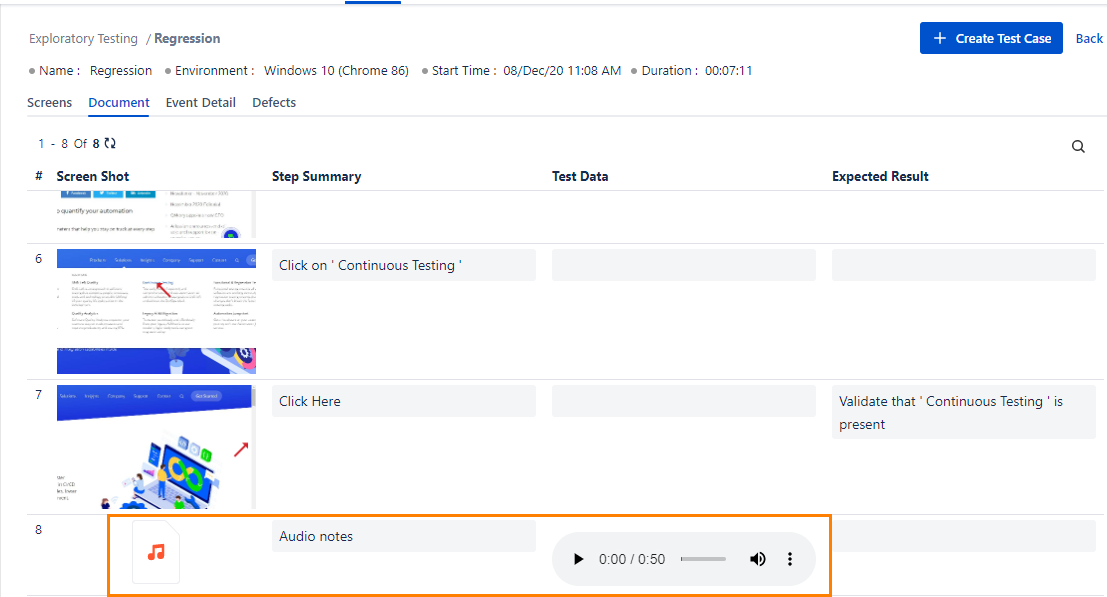
Open the test session to which the audio recording was attached.
Open the Document tab.
You can see the Audio Recordings on the screen.
Play the recorded audio.
...
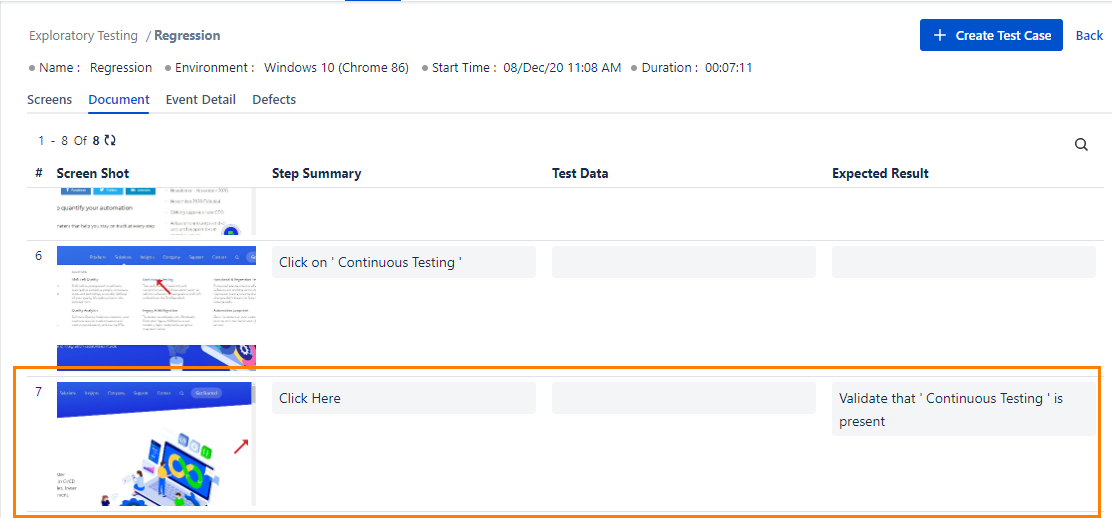
Assertions
User Users can use Assertion to get confirmation on the existence of particular components on the website, for example, a particular button, text, etc.
...
During the on-going ongoing recording session, if you find some important components on the website that you can not avoid, then click on the Start Assertion button.
Once you are done clicking on that element or selecting the text for assertion , and then click on the Stop Assertion button to stop its functionality.
...
When you view the recorded sessions, the Assertions will be displayed as Expected Result as below.
...
On the QMetry for Jira (QTM4J) - Exploratory Testing Extension -
...
Annotating Screenshot: You can annotate the screenshot you captured using the features available on the editor. It allows you to describe any bug/defect/improvement more precisely, which ultimately makes it more comprehensive. Refer to Formatting Screenshot for more details.
...
Users need to fill all required values to log a bug. Following are the values that the user can log a defect with :
Project : Select the project for which the issue is to be logged.
Issue Type : Select the issue type from Story, Task, Bug. The Issue Types populate according to the Issue Types enabled under QMetry Project Settings.
Summary : Enter the Summary that represents a brief about the issue.
Description: Describe the issue in detail in this text area.
Priority : Select the priority of the issue from the drop-down list.
Assignee: Select the assignee who will work on the issue from the drop-down list.
Versions: Select Affected Version applicable to the Defect.
Components : Select the Component applicable to the Defect.
Labels: Select the Labels applicable to the defect. You can select multiple options for the field.
You can see the count of defects logged for the session/test once the session is completed.
...
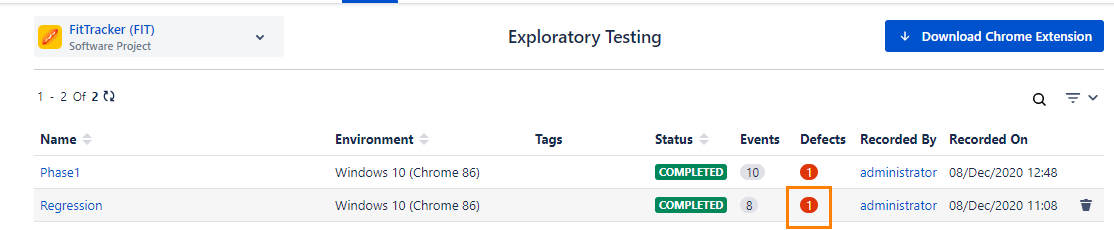
On clicking on the defect count in the grid will show the defect in the Defect tab.
...
To view the issue details in Jira, click on the Key. It opens the Jira details page in a separate tab.
In the Jira issue page, the Environment details are displayed for the bug which is added through exploratory testing.
...
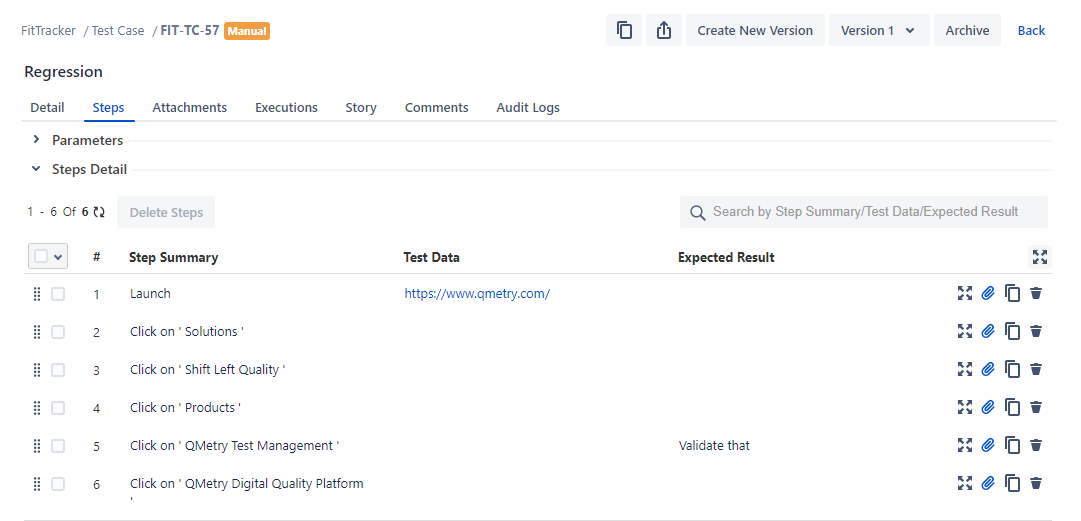
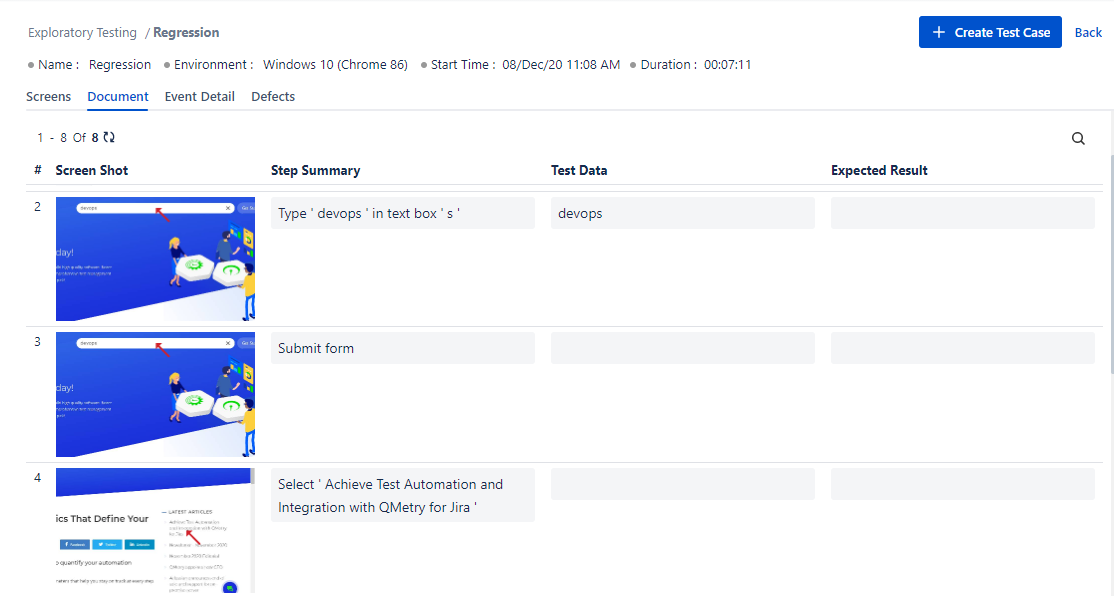
Step Details, Input Data and Expected Output fields are editable. You can modify the field values as per requirement.
The search box is provided at the top to search the required details by its Summary/Test Data/Expected Result.

Event Detail
The Event Detail tab displays event details of each event carried out during recording the session.
There are three vertical panels adjacent to each other:
First The first panel displays events in sequence.
Second panel displays an image for the selected event.
Third The third panel displays the Properties and Values of the selected event.
...
Defects
The Defects tab displays bugs that you logged while recording the session. This issue is created as "Bug" in QMetry Test Management for Jira.
...
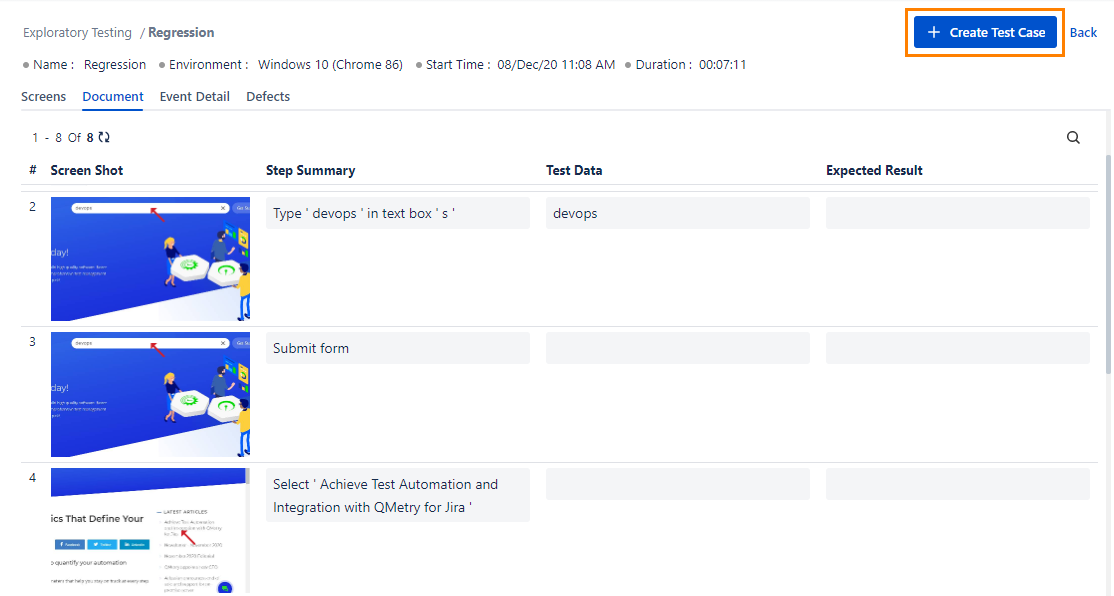
You can add/edit the required details for the test case. If a custom field is marked as mandatory in Configuration, users can enter values for such mandatory fields here and proceed towards test case creation.
...
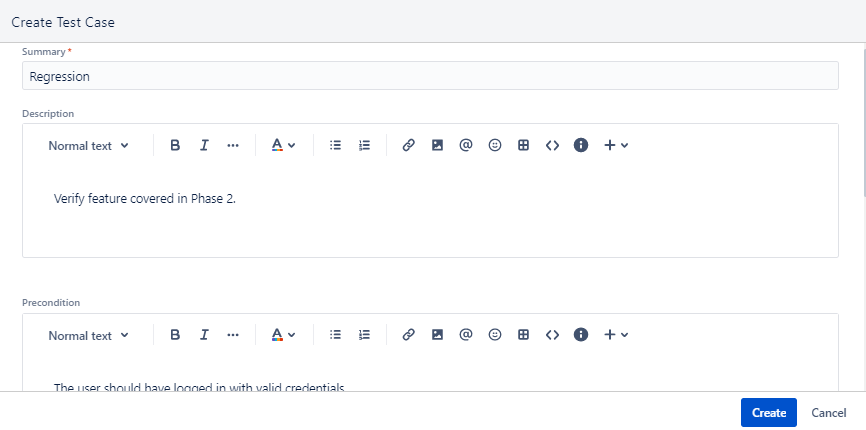

A test case is created in the Test Case tab under Test Management (QMetry menu > Test Management).
...
Images captured during the session are available as attachments with corresponding test steps.