...
→ Charts: You can select from Bar, Line, Pie chart, and tabular format to have a visual view of the report.
...
The tabular view of the gadget is displayed at the bottom of the Pie, Bar, and Line charts for the filters saved for the following reports:
Test Case Reports
Test Execution Reports
Defects Reports
Traceability Reports
Coverage Reports
...
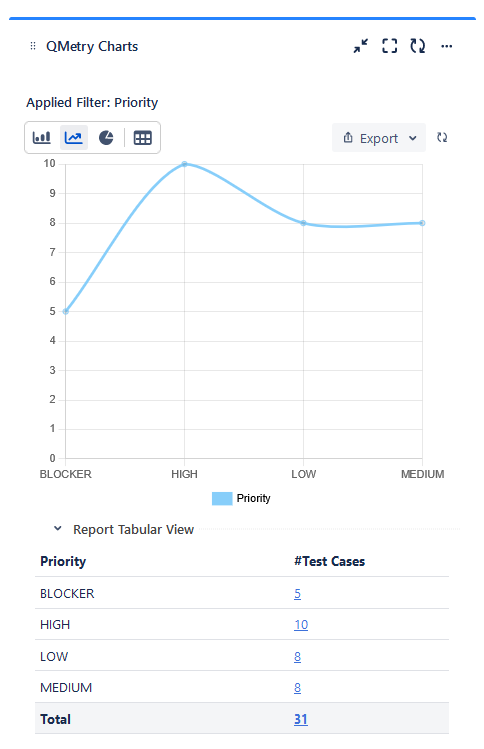
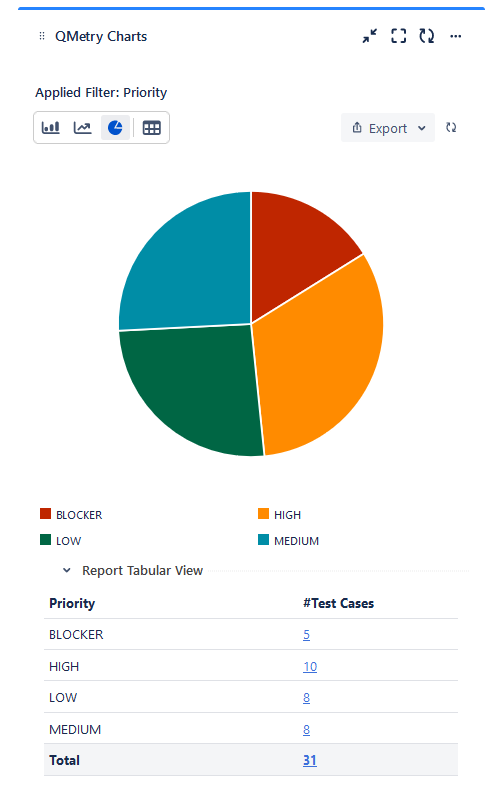
→ Tabular View: Click the icon to view the details in tabular format.
...
A. Export as XLSX: Click on the icon to export the Chart details in an excel Excel file.
B. Refresh: Click the icon to sync the chart with the latest data. If there is any change in the Filter, then it will also get in sync.
...