| Table of Contents |
|---|
Overview
QMetry Chart offers real-time visibility for test quality across projects and teams for various reports. With QMetry Charts you can build customized dashboard widgets inside Jira. It helps Agile teams to release more confidently and on schedule the scheduled time by using relevant analytics, data, and test run reports.
Users can save Filter criteria with which they have generated a report. Using this saved Filter, the user can view the gadget on the QTM4J dashboard. Hence, the report that was generated in the Test Report tab would be seen as a Gadget on the dashboard page.
...
2. Select the Filter you want to generate the chart thereof.
...
3. Click Save.
...
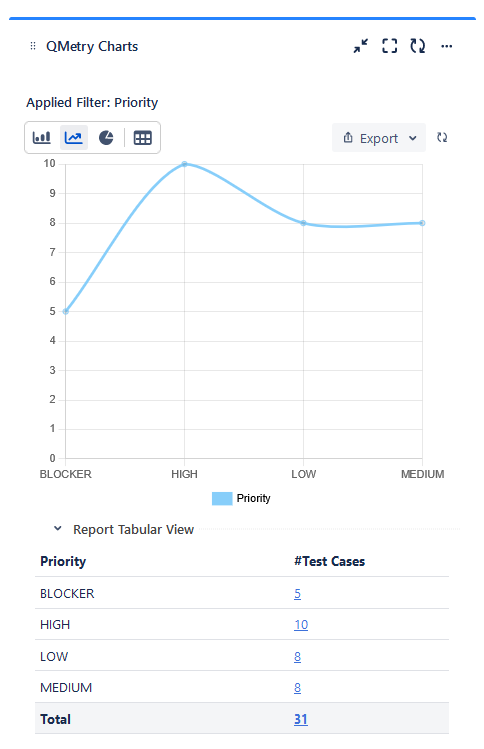
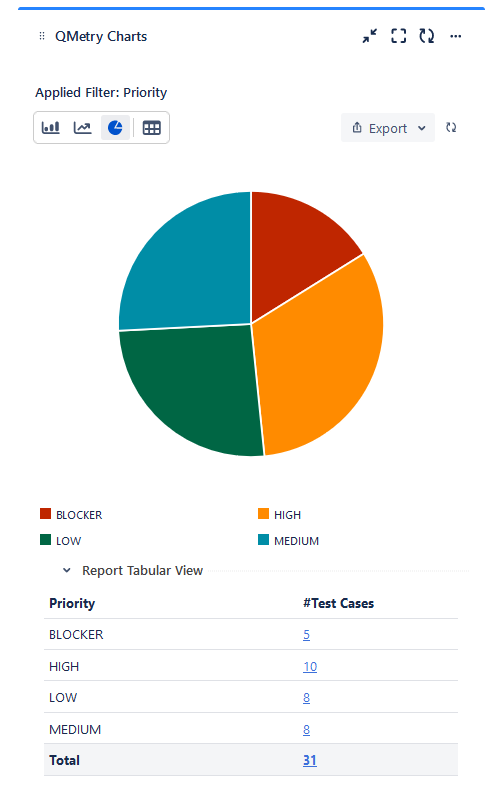
The Chart is generated and displayed. The filter applied for generating the chart is also displayed at the top.
...
→ Charts: You can select from Bar, Line, Pie chart, and tabular format to have a visual view of the report.
The tabular view of the gadget is displayed at the bottom of the Pie, Bar, and Line charts for the filters saved for the following reports:
Test Case Reports
Test Execution Reports
Defects Reports
Traceability Reports
Coverage Reports
...
...
→ Tabular View: Click the icon to view the details in tabular format.
...
B. Refresh: Click the icon to sync the chart with the latest data. If there is any change in the Filter. After that, then it will also get in sync.
...
The asset keys in the drilled-down report are clickable, which opens the asset detail page.
...
The following is the drilled-down report.
...
Download Graphical Summarized View
You can download the graphical summarized charts from QTM4J gadgets in JPEG, PDF, PNG, and SVG formats along with legends, counts, and percentages. This will allow me to share or copy the graphical summary for reporting purposes with various stakeholders.
This feature is available for Pie, Line, and Bar charts (including Vertical Grouped Bar charts and Stacked Bar charts for two-dimensional reports).
Export: You can export the chart details in the following formats.
Xlsx with Steps
Xlsx without Steps
Chart in PNG
Chart in JPEG
Chart in PDF
Chart in SVG
...
Share QMetry Gadgets
User Users can share Jira's dashboard so that QMetry Gadgets can also be shared. It helps in keeping the whole team on the same page.
...