...
The graph shows login count of a specific user on particular datae. Select user from the User drop-down and selected the date range. Click Search Apply to view the details.
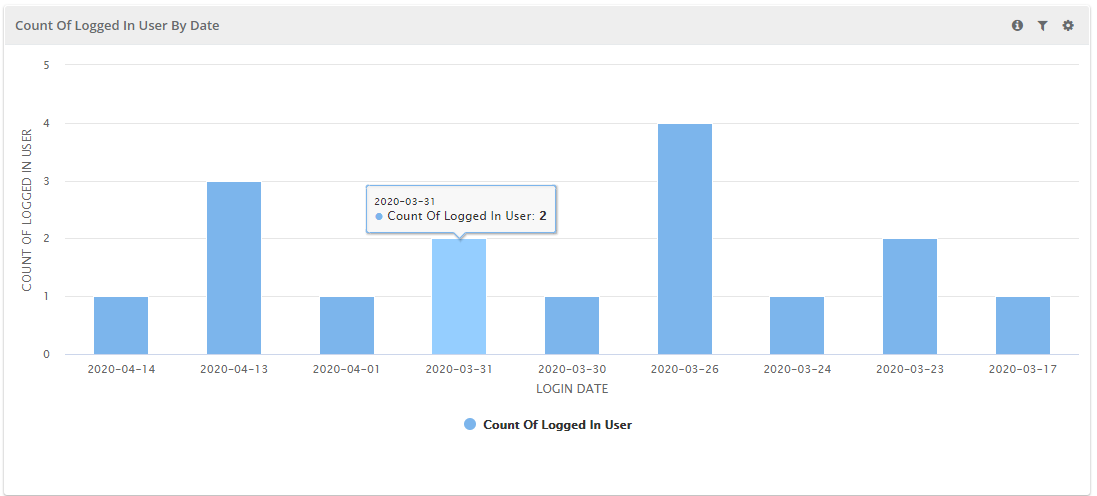
Filter Report:
Click on the Filter icon  on the individual chart to generate the report as per requirement by applying multiple filters.

Logged-in Details
The above graphical chart is displayed in tabular format. This section of the report displays login details of the user, as selected in the drop-down above, in tabular format selected user.

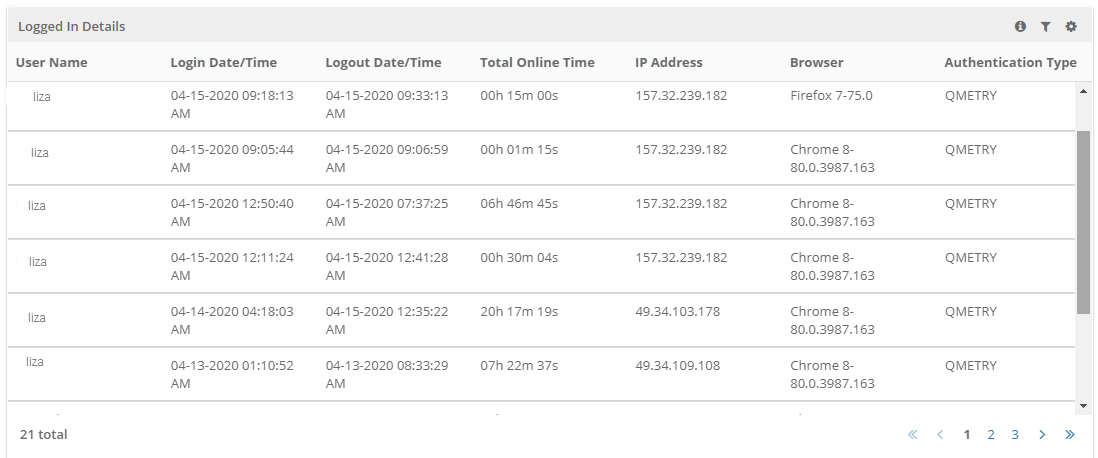
Filter Report:
Click on the Filter icon on the individual chart to generate the report as per requirement by applying multiple filters.
...