The Reusability Report is provided with the purpose to boost the efficiency of testing team with traceability, reusability and visible linkages with other test assets.
...
For example,
There are three different requirements -
1. Users log in with normal credentials.
2. Users log in with SAML authentication.
3. Users log in with LDAP authentication.
There is one test case - 1. Login Verification. This one test case can be associated with all the three requirements. Here, one test case is reused and linked with multiple test cases.
The instance of reusing test assets promotes effective test asset management. For the selected Project, the Reusability Report gives insights into reusability of test assets.
The report displays what percentage of your test cases are linked multiple times with different requirements versus test cases which are not linked with requirements. You can also drill down to the associated requirements.
Select the Project you want to generate and view the Reusability Report of.
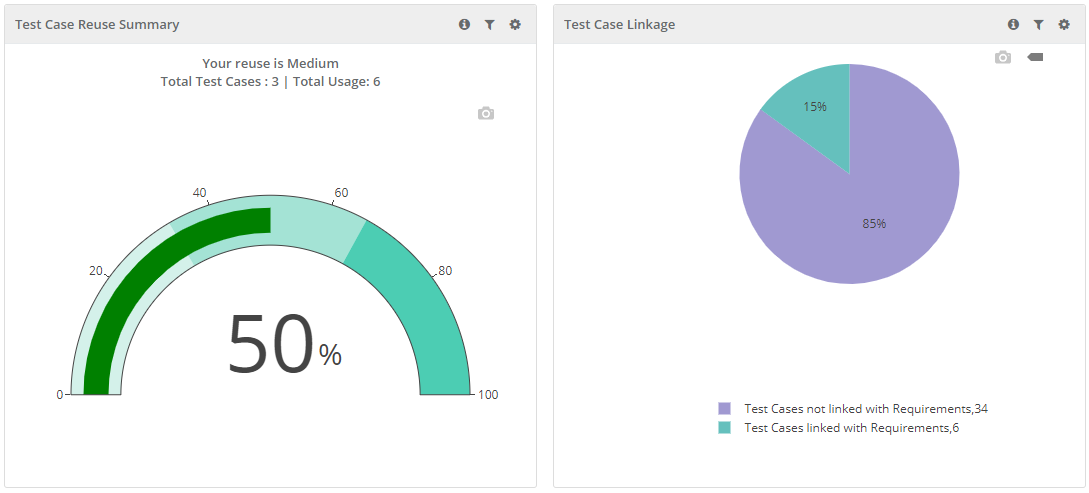
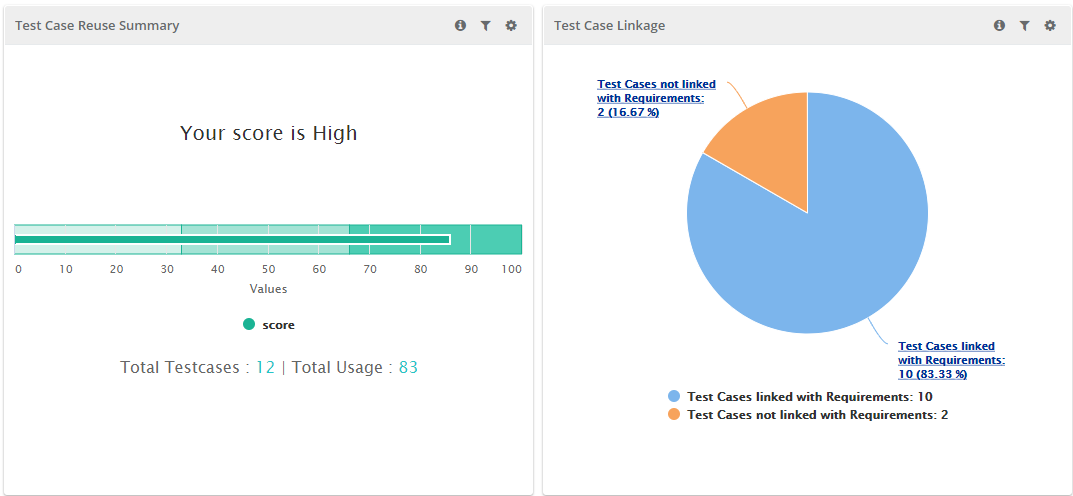
The pie chart displays the proportion of Test Cases linked with Requirements vs. Test Cases not linked with Requirements.
- Test Cases linked with Requirements: The test cases which are linked maximum times with requirements.
- Test Cases not linked with Requirements: The test cases which are not linked with requirements.
The report gives overall picture of utilization of test cases and segregated test cases which are not reused. For ease of comprehension, it also decodes the quality of your test case reusability ratio.
- The pie chart at right displays the count and percentage of Test Cases linked with Requirements and Test Cases not linked with Requirements. The scale at left displays the grade of test case reusability - Low, Good, Very Good.
- Formula for calculating percent =
Math.round(((Total References - Total Test Cases)/Total References)*100) |
- If the test case reusability has improved than what was earlier, then the Faster Rate is also displayed based on the formula.
- Formula for calculating Faster Rate =
...
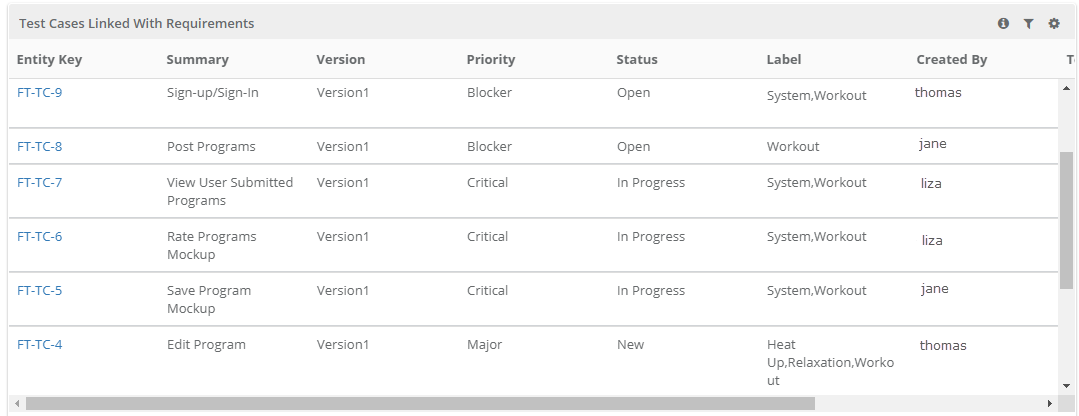
The report also displays test cases in grid with columns Priority, Status, Testing Type, Test Category, and Usages. The details help users analyze which test cases are reused more than others.
Test Cases linked with Requirements
The section displays list of test cases which are linked maximum times with requirements. The grid also shows the reusability count of respective test case.
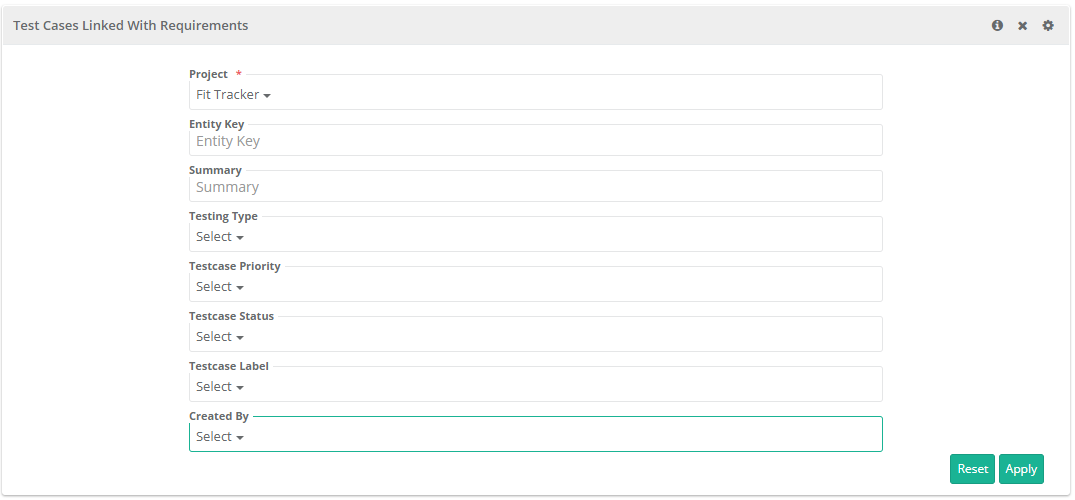
Filter Report:
Click on the Filter icon 
 on the individual chart to generate the report as per requirement by applying multiple filters.
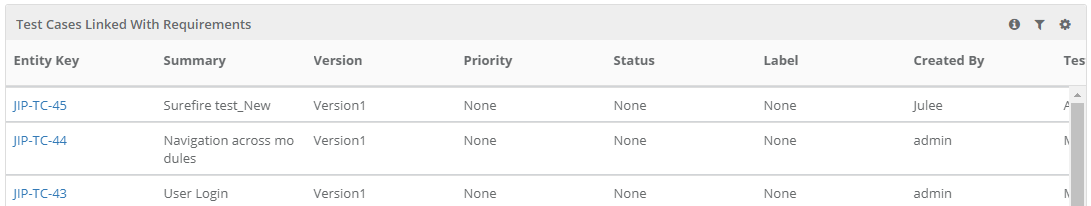
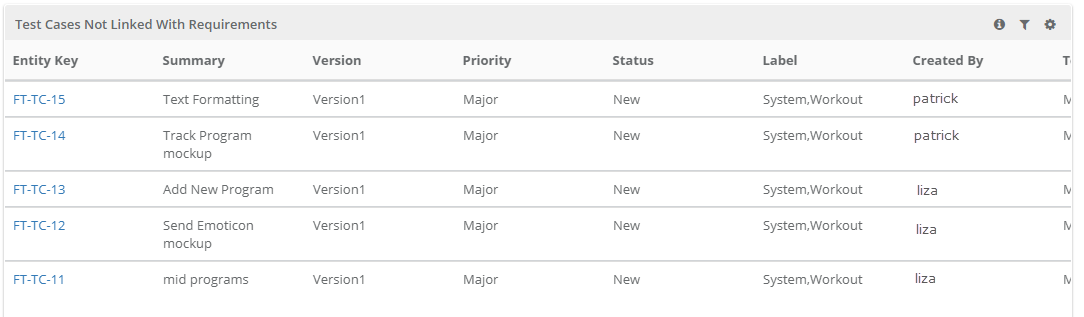
Test Cases not linked with Requirements
The section lists out test cases which are not linked to any requirement yet.

Filter Report:
Click on the Filter icon on the individual chart to generate the report as per requirement by applying multiple filters.
Export Chart in CSV:
To export the individual chart, click on the cog icon on the chart and select Export.
Syncing Report Data
Click on the Refresh icon at the top to sync the report data with data updated in QMetry Test Management. The data of requirements and test cases are updated with the latest changes done in the application. The report is generated anew and you can view reports with real time data.