| Table of Contents |
|---|
...
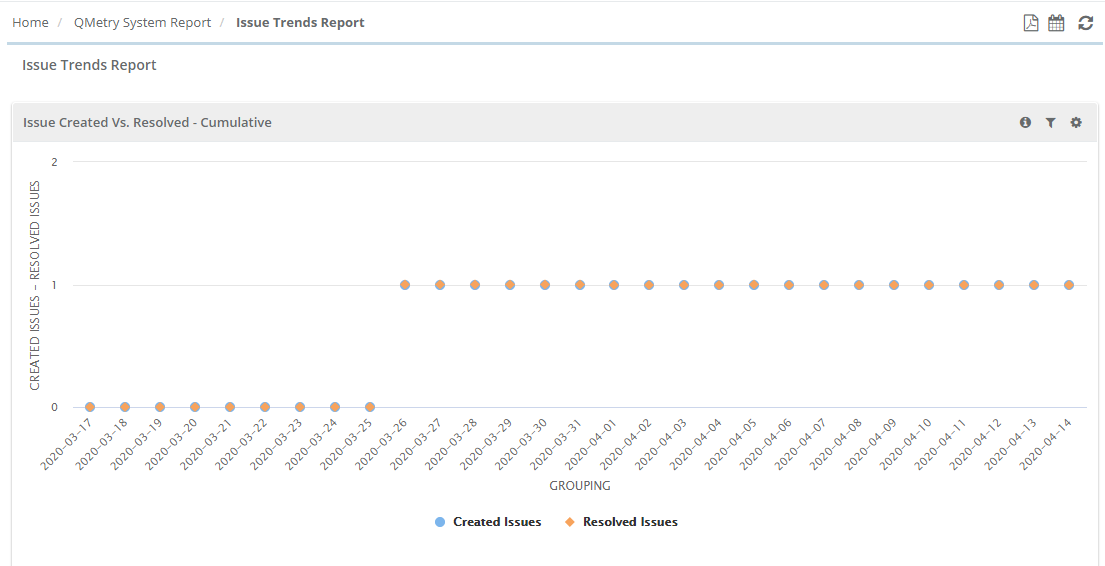
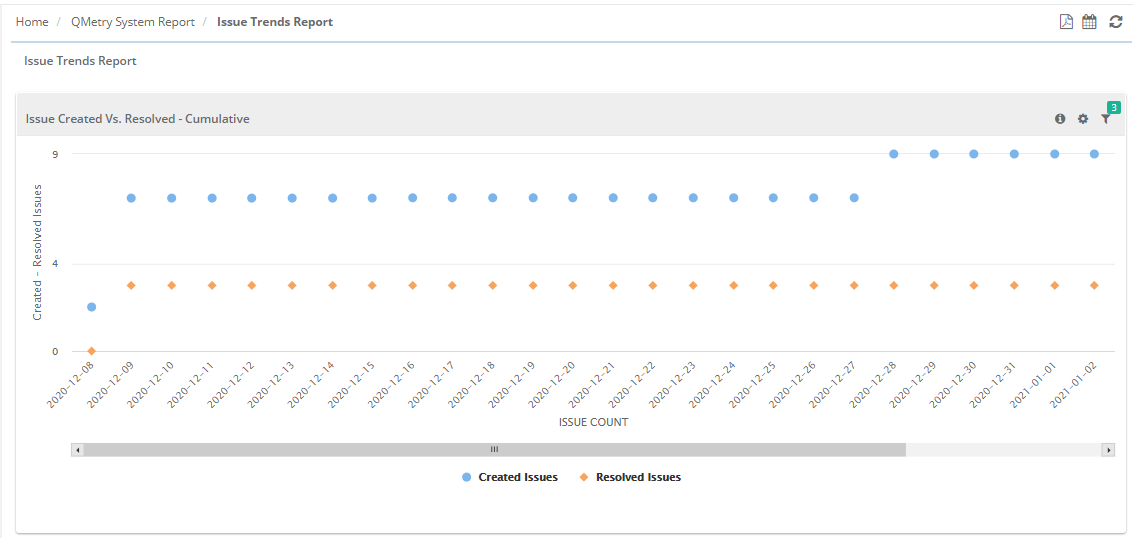
To view the count for Created Issues and Resolved issues, hover the mouse over corresponding lines.
Filter Report:
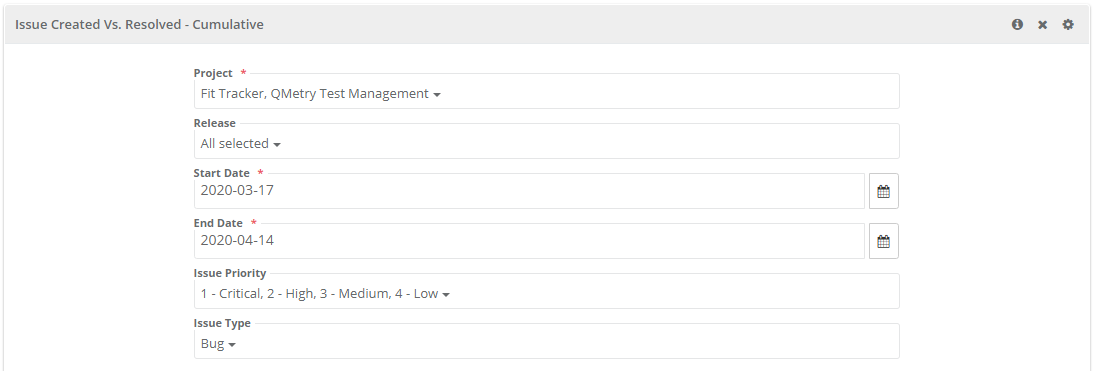
Click on the Filter icon  on the individual chart to generate the report as per requirement by applying multiple filters.
Note: “Releases” are associated with the Internal module issues and are not associated to the Jira issues. Hence, skip selecting the Release filter in case of Jira issues.
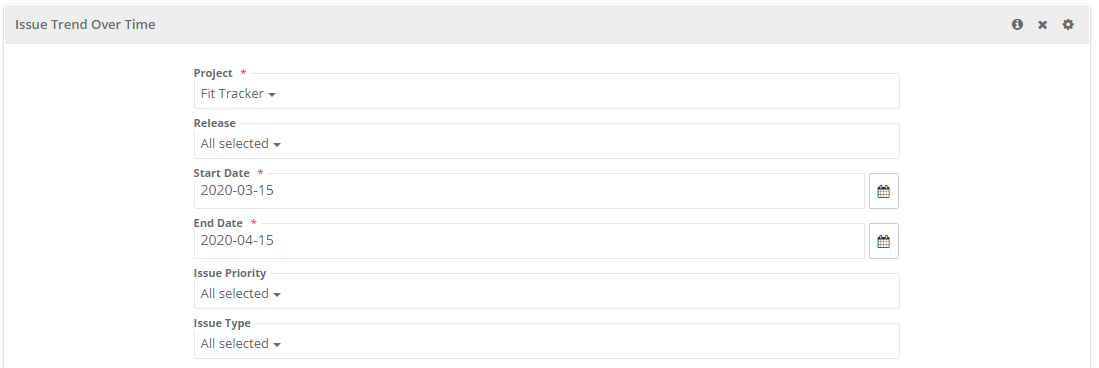
Issue Trend Over Time
This report shows line graph displaying the count of Issues created (on Y-axis) and Creation Date (on X-axis).
...
Note: “Releases” are associated with the Internal module issues and are not associated to the Jira issues. Hence, skip selecting the Release filter in case of Jira issues.
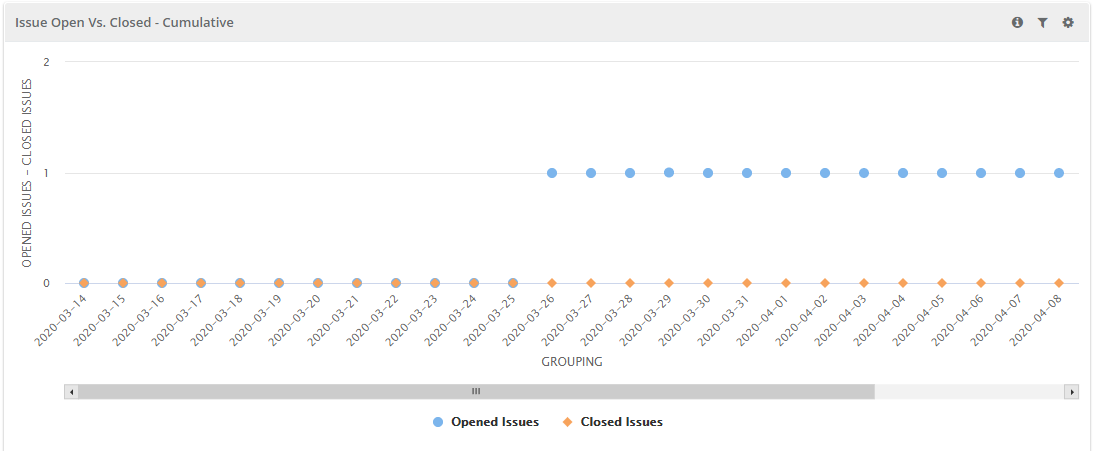
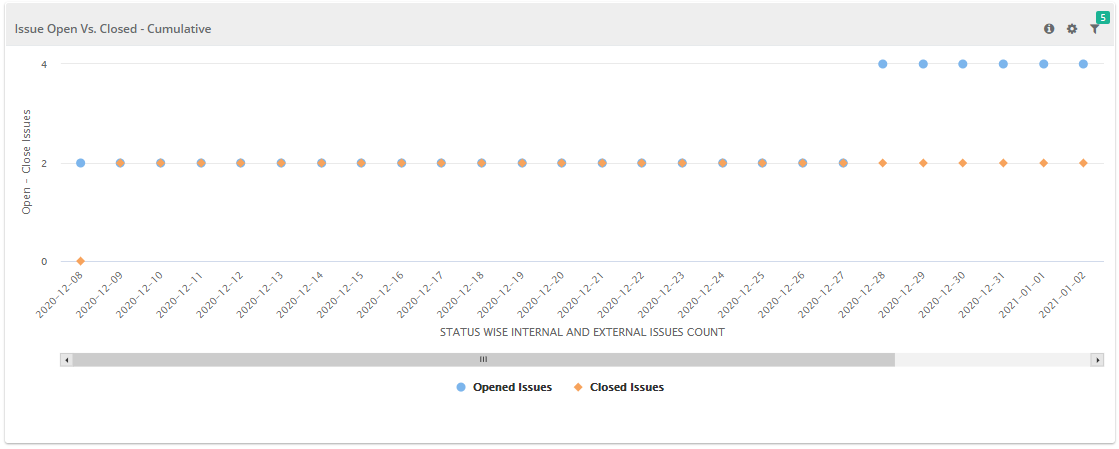
Issue Open Vs. Closed - Cumulative
This report shows line graph displaying count of issues in "Open" State and issues in "Closed" State. The count is cumulative e.g., on 11th May the "Open" Issue count is 3. On 12th May more 4 Issues are added with "Open" State, then the cumulative count of Issue will be 7.
Users can select Open Status and Close Status. In case of Status change of issue, the report also considers the Status change date and current Status of issue.
Filter Report:
Click on the Filter icon on the individual chart to generate the report as per requirement by applying multiple filters.
...