| Table of Contents | ||
|---|---|---|
|
...
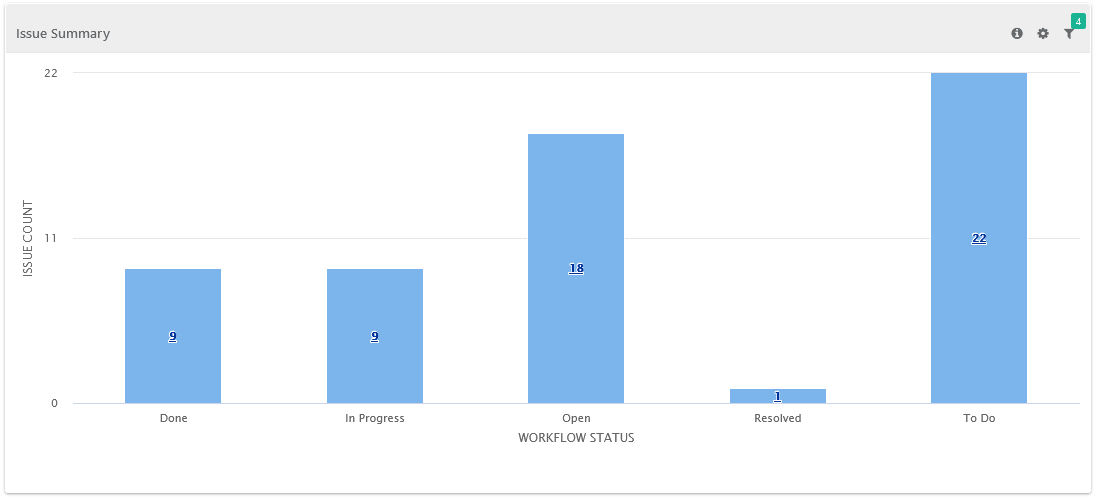
Issue Summary by Workflow Status

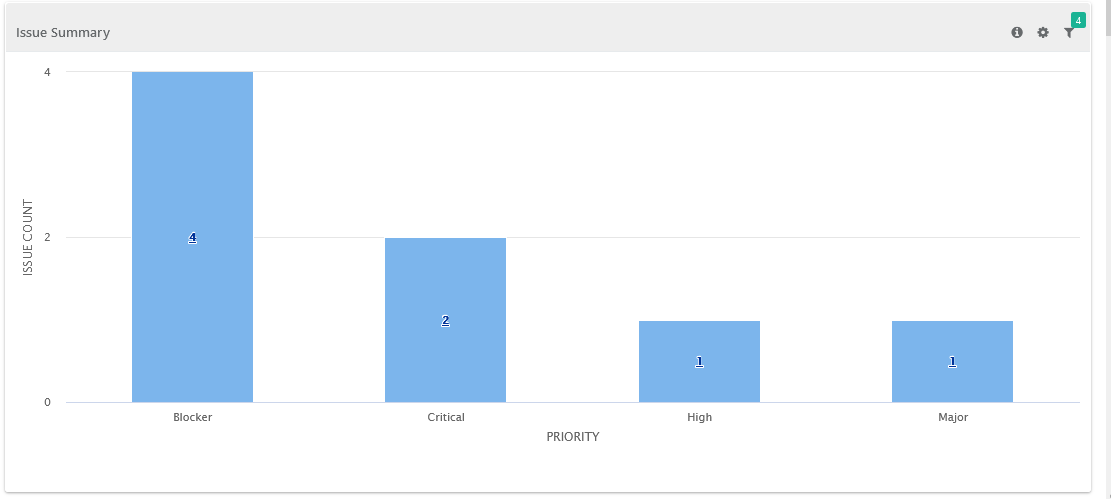
Issue Summary by Priority

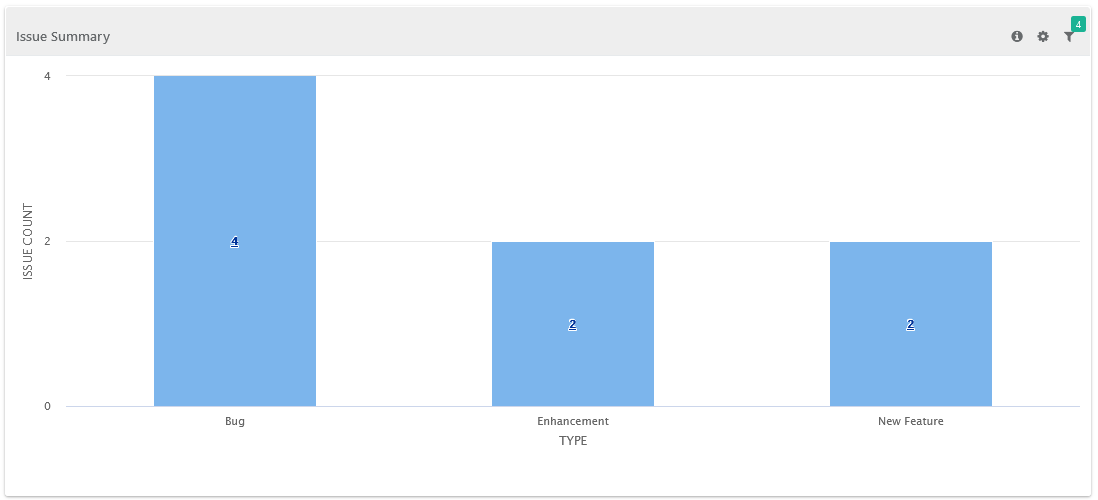
Issue Summary by Type

Issue Summary by QMetry Owner/External Assignee

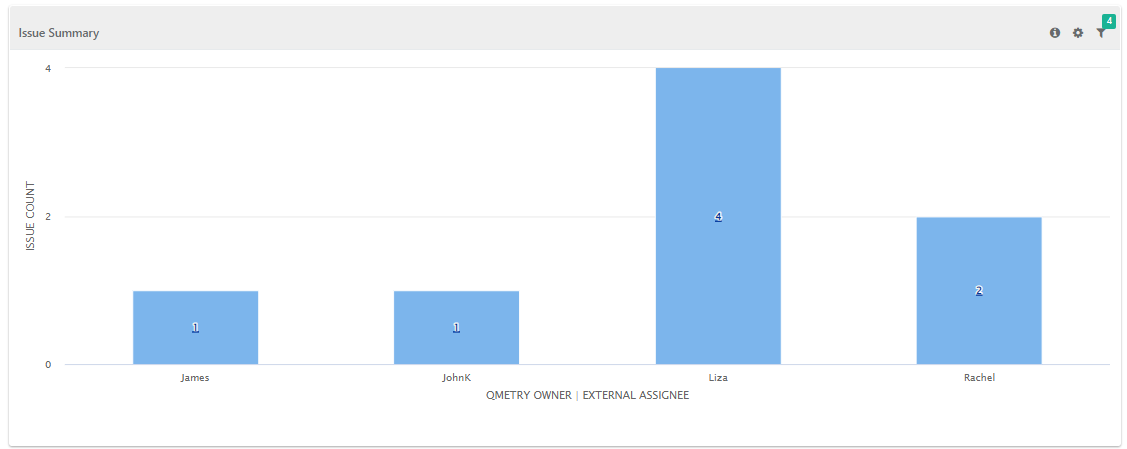
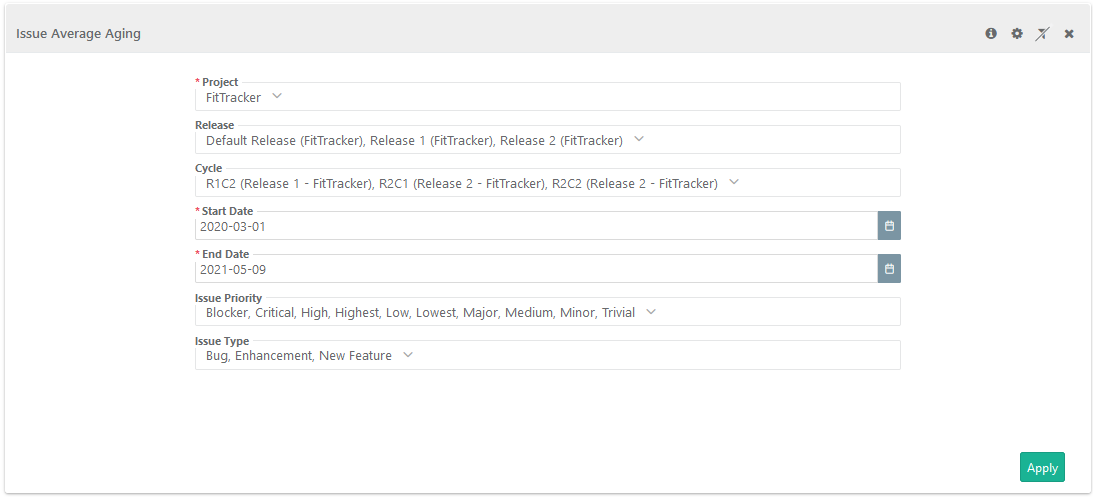
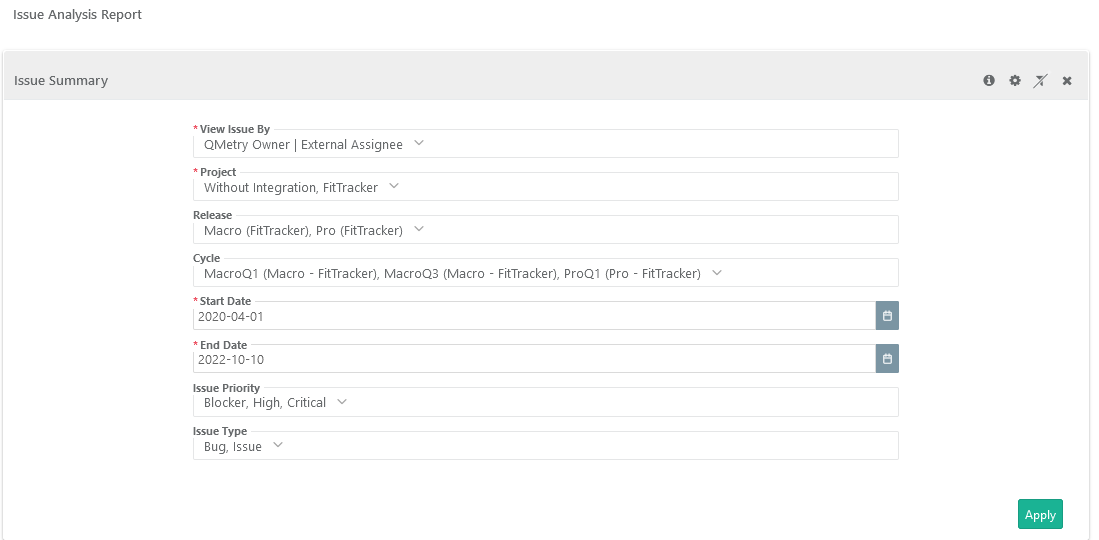
Filter Report:
Click on the Filter icon  on the individual chart to generate the report as per requirement by applying multiple filters.

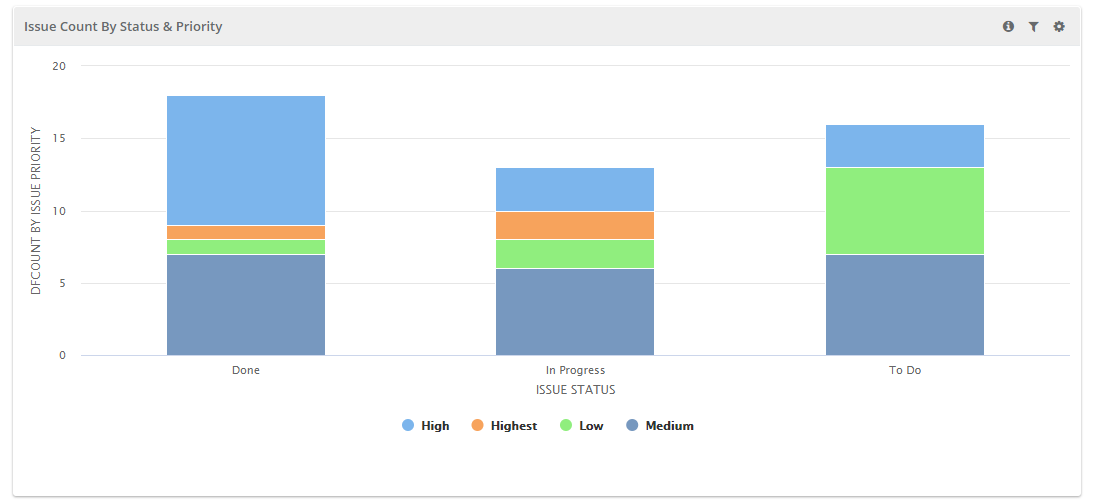
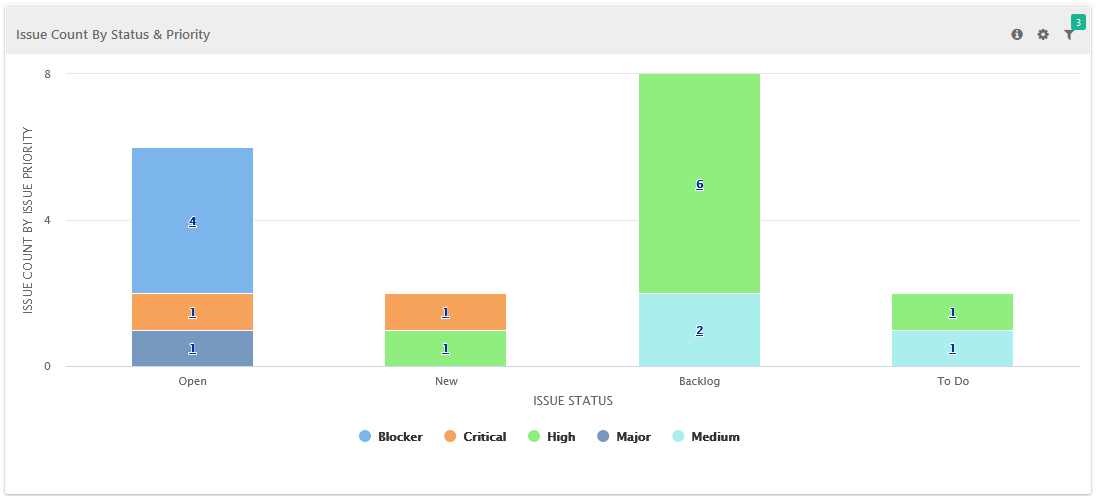
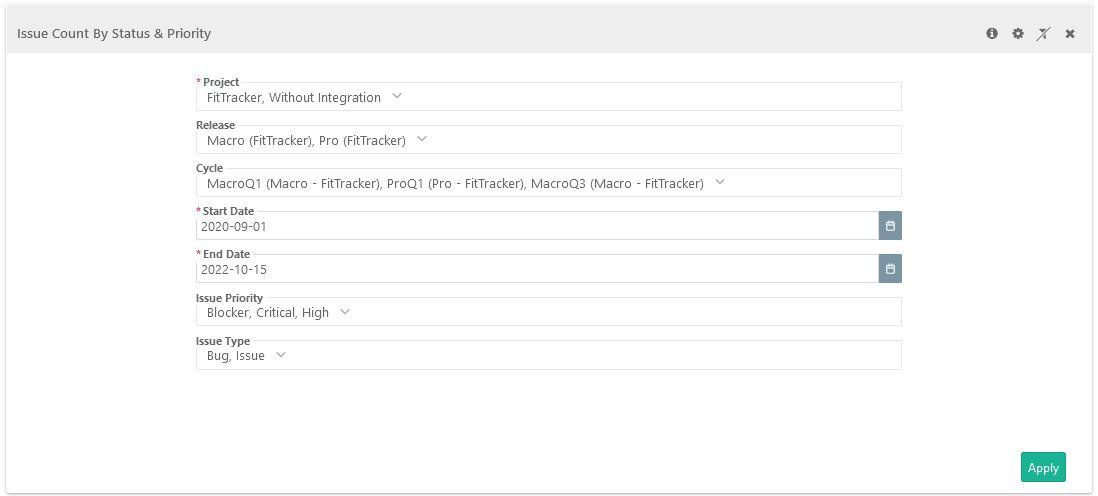
Issue Count by Status & Priority
As the name suggests, the report gives count of issues bu by Status and Priority assigned to them. The legends are provided below the graph.
...
Users can drill down the chart to view details in tabular format.
Filter Report:
Click on the Filter icon on the individual chart to generate the report as per requirement by applying multiple filters.

Issue Velocity compared to Test Cases executed
...
The Y-axis displays count of logged Issues and count of Executed Test Cases.
Archived records will be excluded from the report.
Users can drill down the chart to view details in tabular format.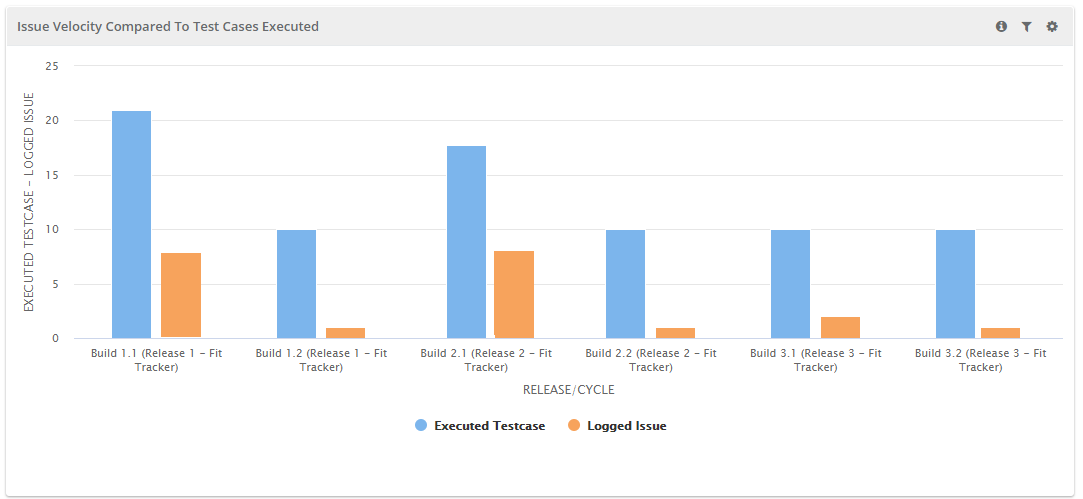

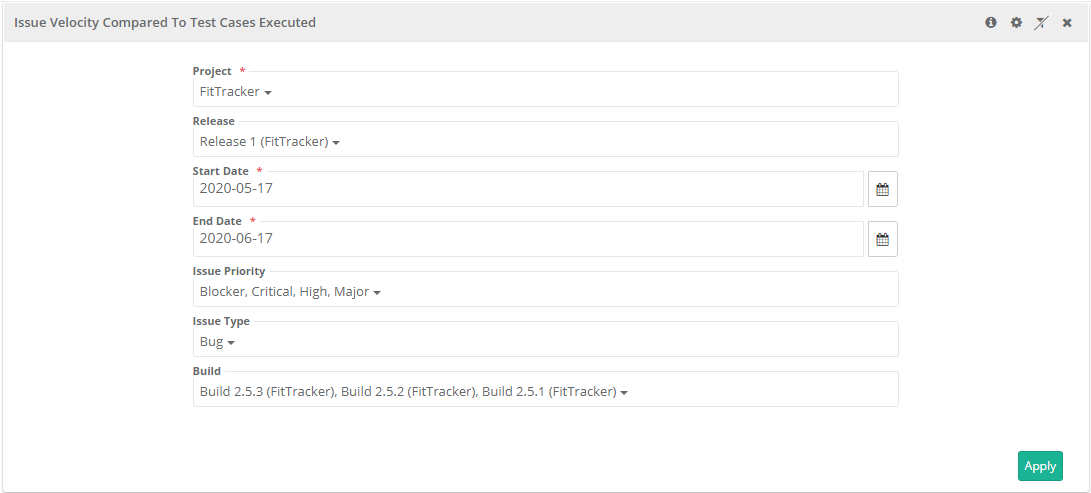
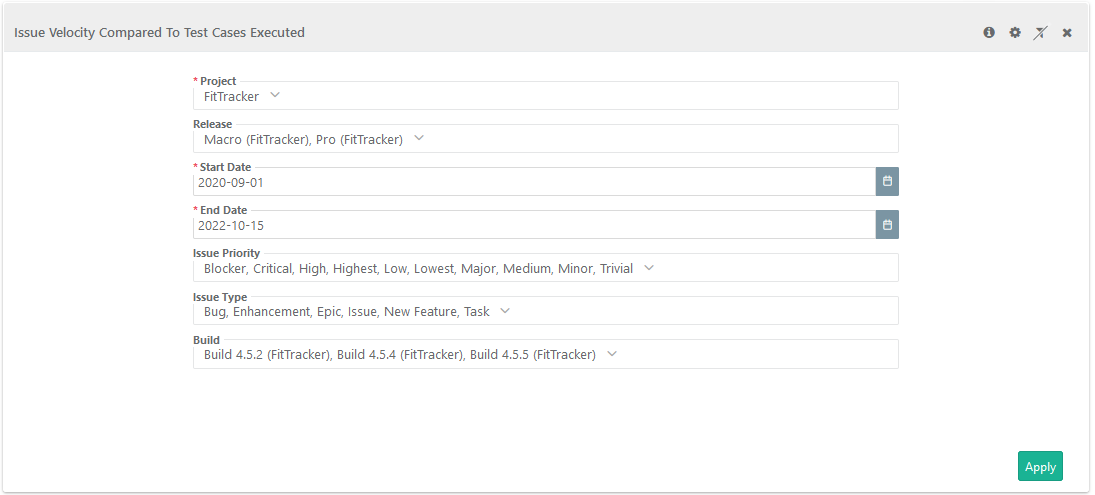
Filter Report:
Click on the Filter icon on the individual chart to generate the report as per requirement by applying multiple filters.
Issue Velocity
...
Compared to Requirements
The report displays the velocity of number of Issues logged during the cycles vs. number of Requirements associated to the release and cycles. The count of logged issues includes distinct count of issues logged to requirements and issues logged during test execution.
...
Users can drill down the chart to view details in tabular format.


Filter Report:
Click on the Filter icon on the individual chart to generate the report as per requirement by applying multiple filters.


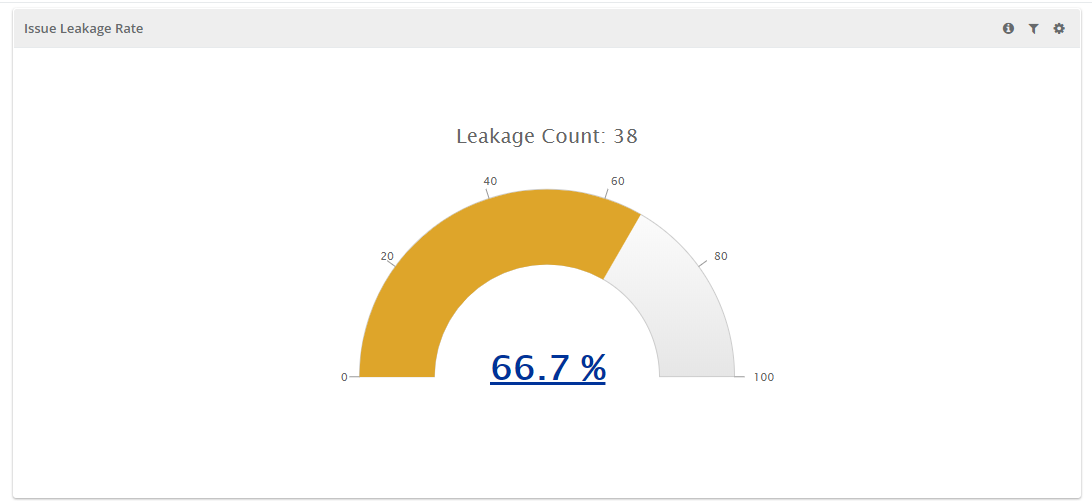
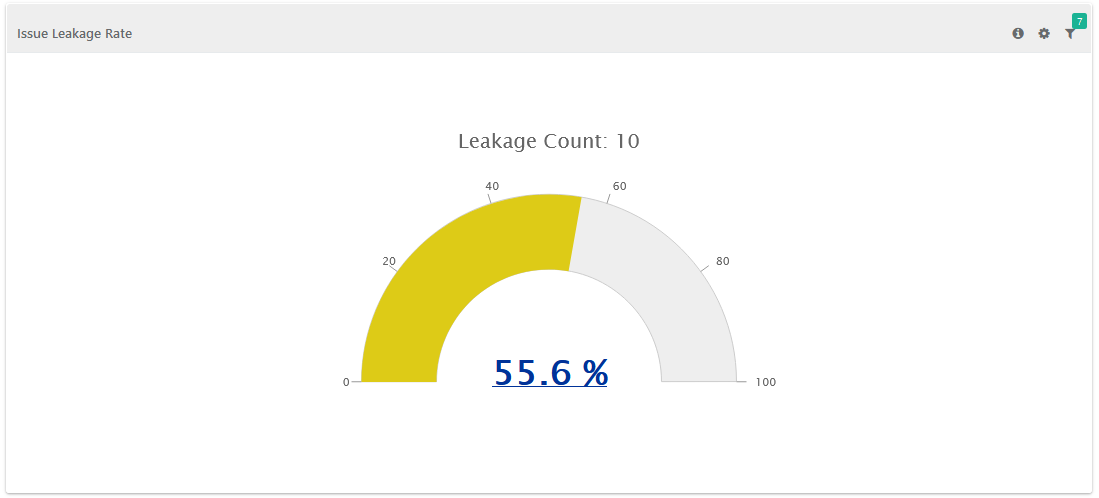
Issue Leakage Rate
...
Number of Issues found during next phase / (Number of Issues found during testing + Number of Issues found during next phase) * 100
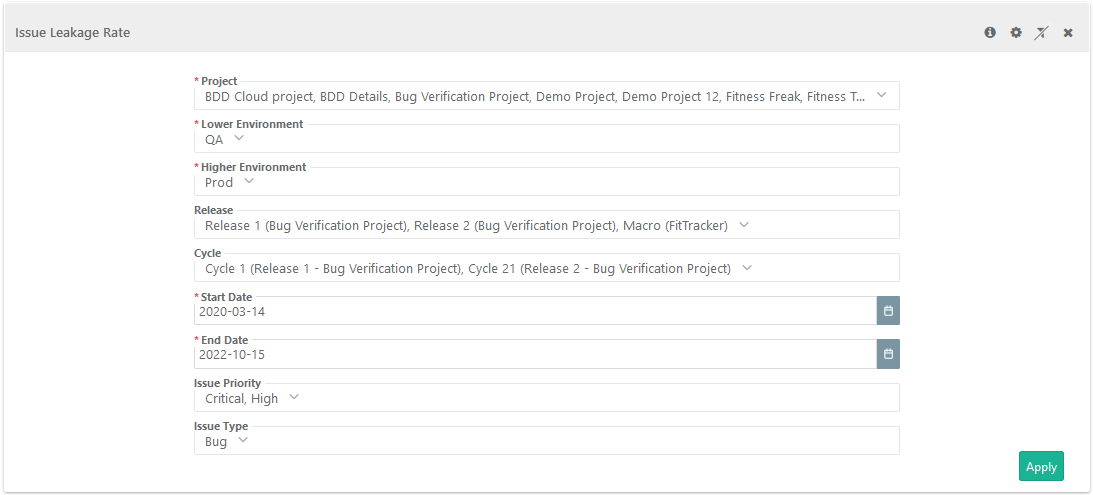
Filter Report:
Click on the Filter icon on the individual chart to generate the report as per requirement by applying multiple filters.
...
- Lower Environment: This can be referred as testing in Previous Environment. For example, build deployed on a staging environment before production.
- Higher Environment: This can be referred as testing at Current Environment which will be in sequence of previous one. For example, build deployed on production environment.

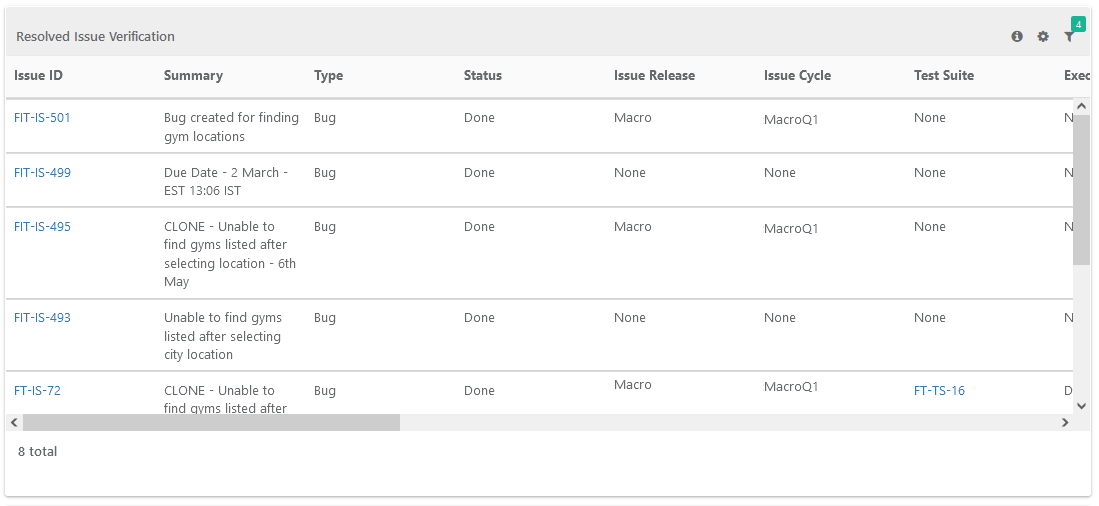
Resolved Issue Verification
Configuration related to Resolved status is provided at project level to define issue status in which issue will be considered as "Resolved". The report shows resolved issues as per the resolved status of issues. For Jira-integrated projects, this report shows the resolved issues based on their resolved status in Jira. The created and resolved date from Jira are shown in the report.
For Azure and Rally integration, this report shows the resolved issues depending on the relevant "Default Resolved Status" in the project settings. Configure Resolved status for issue from Projects > Project/Release/Cyclefrom Managing Projects, Releases and Cycles.
When multiple projects with different Resolved status configurations are selected to generate the report, it displays issue records for respective projects accordingly.The report is generated on the basis of the status you selected as "Default Resolved Status".
The Resolved Issue Verification tabular report displays traceability of issues which are marked as "Resolved". Issues are displayed with their associated test suites and test cases.
...
Linkage level column is added in the Resolved Issue Verification report to display the linkage level of an issue. If an issue is linked at both the level, then different entries are displayed for each level.
The report also displays considers issues linked to test step/test case during execution as well as issues directly linked to test case from the Issues tab of test case details page. The report displays the details of test suites and /test cases associated to resolved issues.

Filter Report:
Click on the Filter icon on the individual chart to generate the report as per requirement by applying multiple filters.
...
Filter Report:
Click on the Filter icon on the individual chart to generate the report as per requirement by applying multiple filters.