| Table of Contents | ||
|---|---|---|
|
...
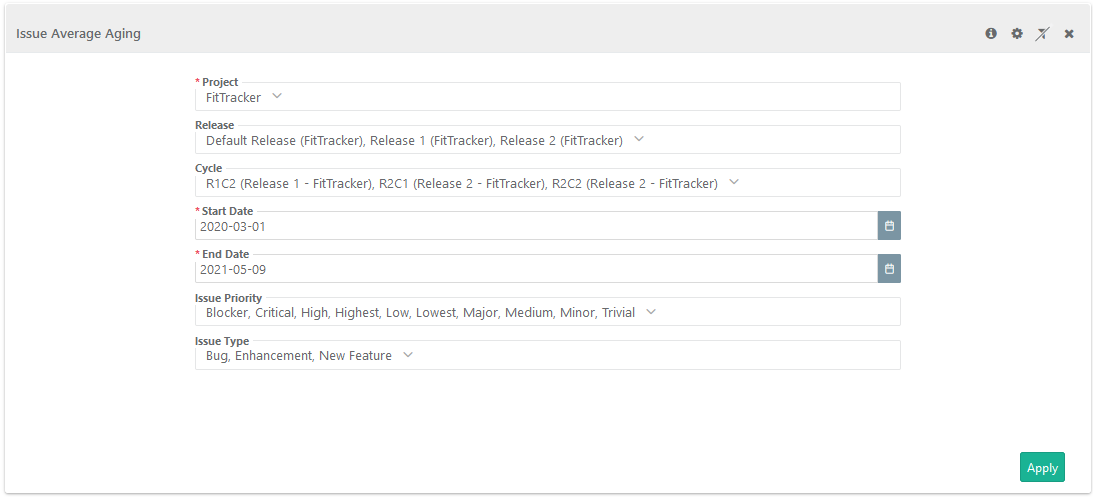
Filter Report:
Click on the Filter icon  on the individual chart to generate the report as per requirement by applying multiple filters.
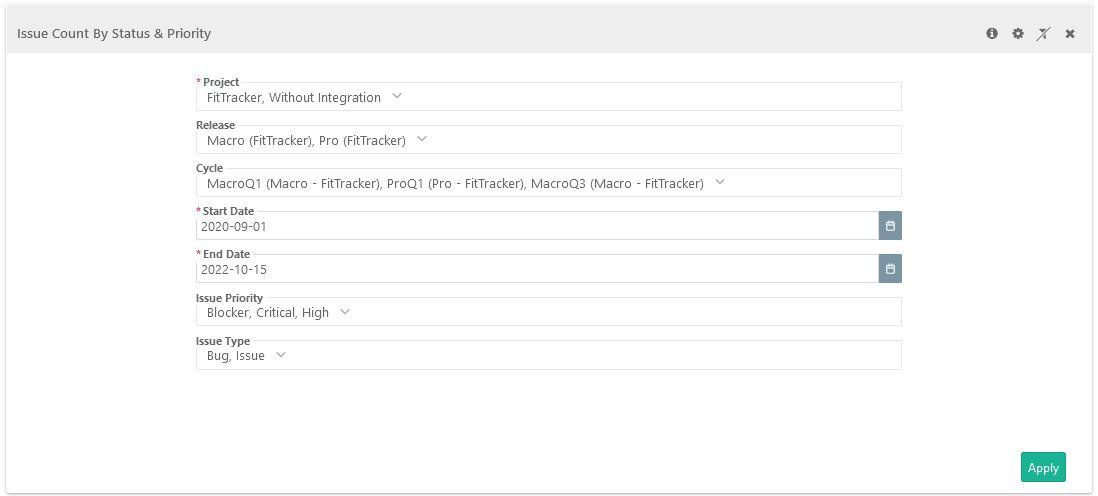
Issue Count by Status & Priority
...
Filter Report:
Click on the Filter icon on the individual chart to generate the report as per requirement by applying multiple filters.

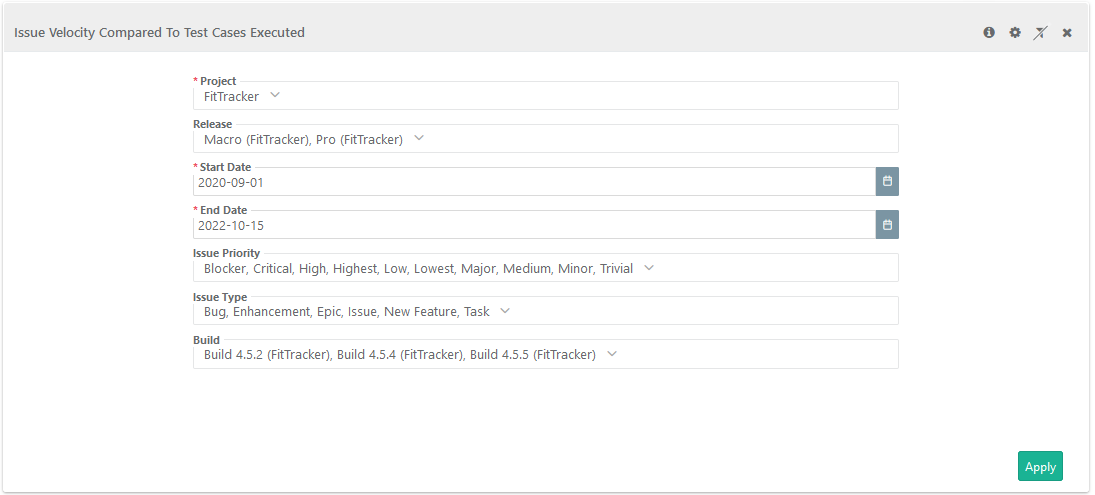
Issue Velocity compared to Test Cases executed
...
The Y-axis displays count of logged Issues and count of Executed Test Cases.
Archived records will be excluded from the report.
Users can drill down the chart to view details in tabular format.
...
Filter Report:
Click on the Filter icon on the individual chart to generate the report as per requirement by applying multiple filters.

Issue Velocity
...
Compared to Requirements
The report displays the velocity of number of Issues logged during the cycles vs. number of Requirements associated to the release and cycles. The count of logged issues includes distinct count of issues logged to requirements and issues logged during test execution.
...
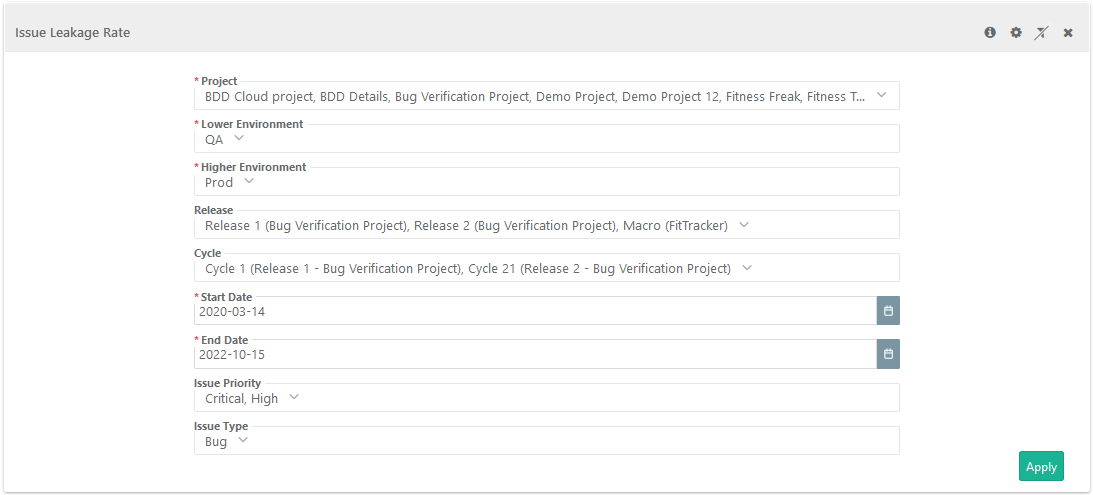
- Lower Environment: This can be referred as testing in Previous Environment. For example, build deployed on a staging environment before production.
- Higher Environment: This can be referred as testing at Current Environment which will be in sequence of previous one. For example, build deployed on production environment.

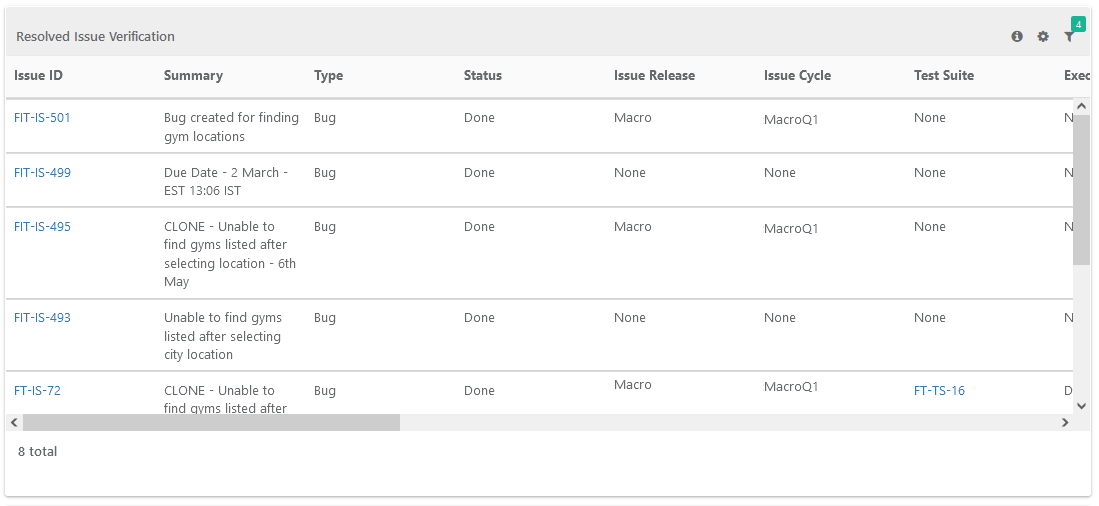
Resolved Issue Verification
The report shows resolved issues as per the resolved status of issues. For Jira-integrated projects, this report shows the resolved issues based on their resolved status in Jira. The created and resolved date from Jira are shown in the report.
...
The report considers issues linked to test step/test case during execution as well as issues directly linked to test case from the Issues tab of test case details page. The report displays the details of test suites/test cases associated to resolved issues.

Filter Report:
Click on the Filter icon on the individual chart to generate the report as per requirement by applying multiple filters.
...
Filter Report:
Click on the Filter icon on the individual chart to generate the report as per requirement by applying multiple filters.