| Table of Contents | ||
|---|---|---|
|
About QMetry Test Management Exploratory Testing
QMetry Test Management Exploratory Testing is an add-on that has been designed to empower users to carry out testing while they explore websites, to ensure that testers’ time is invested in investigating the site instead of writing every single test activity, and to cultivate the culture of flawless communication in the organization.
Benefits of QMetry Test Management Exploratory Testing
QMetry Test Management Exploratory Testing helps users identify problems with the website/application under test. The add-on verifies the website through a browser to confirm that it is functioning properly.
The functionality traces actions performed during Exploratory UI testing in browser, and converts it into modular code that can be used for automated regression Tests.
Each event and navigation are recorded, which provides ready-to-use Automated Documentation.
The tool allows its users to log issues just on a mouse click. It enables users to add visuals while logging issues, which makes it easy for development team to catch the scenario where the application fails.
All the features intend to generate precise and clear communication, which lessens the chances of confusion and enhances the productivity of resources.
Install QMetry Exploratory Testing add-on and get started recording the events you perform on applications/websites. View results of these recorded sessions on QMetry Exploratory Testing instance.
Steps to initiate Exploratory Testing using QMetry Test Management Exploratory Testing
Step 1. Install QMetry Test Management Exploratory Testing chrome extension.
Step 2. Generate API Key in QMetry Test Management to log into the extension.
Step 3. Start exploratory testing and recording sessions through QMetry Exploratory Testing.
Pre-requisites:
To perform exploratory testing, users should have the "Modify" rights for the Exploratory Testing module.
Users with the "View" rights can only view the recorded sessions for the project.
How to install QMetry Exploratory Testing add-on
If you are using the Exploratory Testing module very first time, then go to Automation > Exploratory Testing. Click on the Install QMetry Test Management Exploratory Testing button.
As an alternate, click on the link below to open QMetry Exploratory Testing page in Chrome web store.
https://chrome.google.com/webstore/detail/qmetry-test-management-ex/jbnnldpbnobjfgodglhdlbdigibhoacn
Click on the ADD TO CHROME button on the top right corner to download QMetry Exploratory Testing Chrome extension.
Once the extension is added to your chrome browser, it will appear like below.
...
Log into QMetry Exploratory Testing
Open the Chrome browser.
Click on the QMetry Exploratory Testing icon at right.
If you are using QMetry Exploratory Testing add-on for the first time, then provide -
QMetry URL: This is your QMetry Test Management instance.
API Key: Generate the API Key in QMetry Test Management (from Automation > Exploratory Testing) and enter the same in this field.
...
Click on the Login button.
Exploratory Testing (Record)
Users can record test sessions using QMetry Exploratory Testing add-on. These sessions will be recorded and stored in QMetry Test Management instance that you mentioned while logging into the add-on.
Record while you Explore
Once you log into QMetry Exploratory Testing, the next window opens asking for details on the test session/test scenario.
Project: Select the Project in QMetry Test Management for which you want to conduct exploratory testing.
Name: Enter the session name by which the test session/test scenario will be identified.
Platform: Mention the Platform against which the test scenario is to be executed.
Tags:You can tag the session to categorize it. You can create multiple tags for a session e.g., Import, Export, Integration.
Extra Notes: Enter required notes or comments here in the text box.
Record Console and Network Logs: Select the check box to capture the Console and Network Logs before you begin recording the exploratory testing session . The Console logs will be displayed in the Console Logs tab and the Network Logs will be displayed in Network Logs tab with other recorded session details. These logs will also be added as attachments to the test case created from the session.
Pre-requisites to record Console and Network Logs
QMetry Test Management Exploratory Testing v1.0.6 or above (Chrome Extension)
QMetry v8.6.2 and above.
Select The checkbox to “Record Console and Network Logs” before beginning to record the exploratory testing session. The checkbox is disabled by default.
...
Click on the Start Recording button to initiate the recording of your actions on the website or application.
Note: It is recommended that you open the site you want to explore before you start recording.
The icon beside the address bar indicates that the recording is now in-progress.
...
You can add Bugs/Issues, Audio and Annotations to your current recording.
...
Audio Recording
You can add a voice-over to the recording by clicking on the mic icon.
...
The icon is started displaying beside the address bar.
...
When you are done with audio recording, click on the icon at the right of the address bar.
...
It displays the stopwatch. Click on the Stop button to stop audio recording.
To cancel the audio recording, click on the Discard button.
How to play the audio recording?
Open the test scenario/session to which the audio recording was attached.
Open the Document tab.
You can see the Audio Recordings on the screen.
Play the recorded audio. You can also download the recordings.
...
Assertions
User can use Assertion to get confirmation on existence of particular components on the website, for example, a particular button, text, etc.
...
During the on-going recording session, if you find some important components on the website that you can not avoid, then click on the Start Assertion button. It will enable the as
Once you are done clicking on that element or selecting the text for assertion, and then click on the Assertion button again to stop its functionality.
When you view the recorded sessions, all the Assertions will be displayed as Expected Outcome. You can also edit the recorded Assertions as the field is editable.
...
On the QMetry Exploratory Testing Extension -
Annotations: Annotations can be added while recording the test session. Enter annotation and click Add.
Pause: Click on the

icon to pause the session recording for the time being. You can resume the recording at your convenience.
Play: Click on the Play icon

to resume the test recording from where it was paused.
Stop: Click on the

icon to stop the session recording. The uploading will start on stopping the session recording.
Log Issues
Log Issues while Recording
You can log issue to the scenario while recording the test session. The issue gets logged into Jira.
Note: The logging issue operation will pause your session for a while. If you wish to resume the session, then close the issue logging screen after logging the issue.
...
Click on the Bug icon
The screenshot of current page opens in a separate tab.
The page also have options like any other image editor.
Annotating Screenshot: You can annotate the screenshot you captured using the features available on the editor. It allows to describe any bug or issue more precisely, which ultimately makes it more comprehensive.
...
Logging an Issue in QMetry
User can now log the issue with the QMetry field values like following.
Project: Select the project for which the issue is to be logged.
Summary: Enter the Summary that represents brief about the issue.
Priority: Select the priority of the issue from the drop-down list.
Labels: Select the Labels applicable to the issue. You can select multiple options for the field.
Issue Type: Select the issue type from Bug, Enhancement, New Feature.
Owner: Select the assignee who will work on the issue from the drop-down list.
Description: Describe the issue in detail in this text area.
Logging an Issue in QMetry for Jira - Test Management
If Jira is configured with the project in QMetry, then you can log issue directly in Jira.
First select the Jira instance to which you want to log the issue.
The External Project field values will populate according to the instance selection.
Select the Jira Project you want to log issue to.
...
Other fields will appear in accordance with project selection.
View Logged Issues
Issue Logged in QMetry
In QMetry, go to Automation > Exploratory Testing.
You can see the count of issues logged for the tests/sessions.
...
On clicking on the issue count in the grid opens the issue screenshot attached in support of the issue.
You can view the details related to the issue.
...
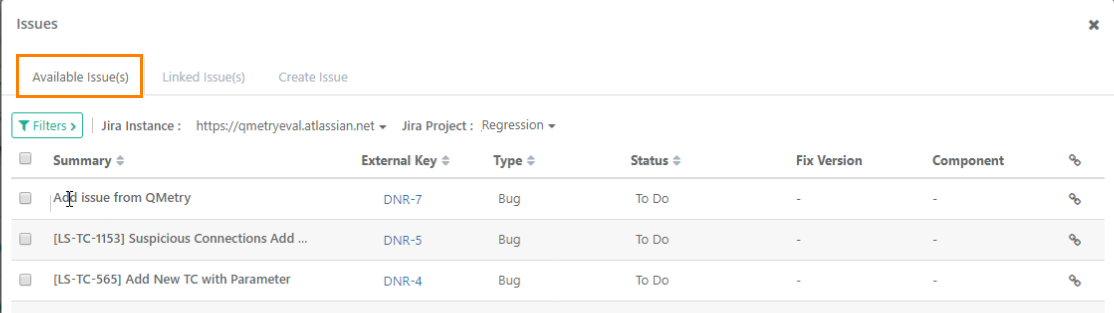
Issue Logged in QMetry for Jira - Test Management
In QMetry, go to the Execution Screen.
Click the Bug icon . It opens the Issues screen.
The issues logged from QMetry Exploratory extension can be seen in the Available Issues tab on the Issues screen.
Log Issues without Sessions
You may come across certain issues that you can not associate with a session instantly. QMetry Exploratory Testing allows you to log issues even without recording a session.
Issues, logged without session, are added to the Issue module in QMetry Test Management.
Steps
Open the QMetry Exploratory Testing add-on.
Click on the Log Issue button at top right corner of the QMetry Exploratory Testing extension main screen.
...
It captures the screenshot of the website screen currently open.
Enter issue details same as you do when logging an issue during recording the session. You can log issues to QMetry as well as QMetry for Jira - Test Management.
If you have added an issue to QMetry, then it is added to the Issue module in the corresponding project.
...
If you have added an issue to QMetry for Jira, then it is added to the Jira project that has been configured with your QMetry project.
Automated Documentation
After performing testing task through QMetry Exploratory Testing, users can then view the recorded sessions in QMetry Test Management.
Note: You should have the "View" rights for Exploratory Testing for the project to view the sessions recorded by other users of the project.
Log into QMetry Test Management.
Go to Automation > Exploratory Testing.
...
The records display Session Name, the Platform on which it has been tested, Status, and the Date and Time it has been Recorded On. The count of Events recorded, Tags, and Defects logged for the session are also displayed on the screen.
Filter Session Records
If it is a long list of recorded sessions, then you can apply filter to get the required session.
The following filters can be applied to search required sessions:
Session Name
Platform: Search test scenario by Platform that was mentioned while its creation.
Status: Search test scenario by its status either "In Progress" or "Completed" or "All"
Created By
Recorded Duration: Mention the date range within which the test scenario was created.
Just click on the session you want to view the recordings of.
The next screen shows the following tabs on it:
Screens
Document
Event Detail
Defects
Console Logs
Network Logs
Edit Session Details
Expand the upper panel by clicking on More Details.
...
Session Name, Note and Tag are editable. Make required changes in the session details.
Delete Sessions
Users can delete test sessions that are no more required.
Go to Automation > Exploratory Testing.
Click on the cog icon at the top right corner and select Delete. It makes check boxes for session records visible.
From the test records, select the test you want to delete by checking the check box(es).
Click on the Delete button at top right to delete the session(s) selected on the grid.
...
Screenshot View
The Screens tab contains screens captured during testing activity. The thumbnails are displayed on the sidebar at left.
Click on the thumbnail to view the full image at right.
...
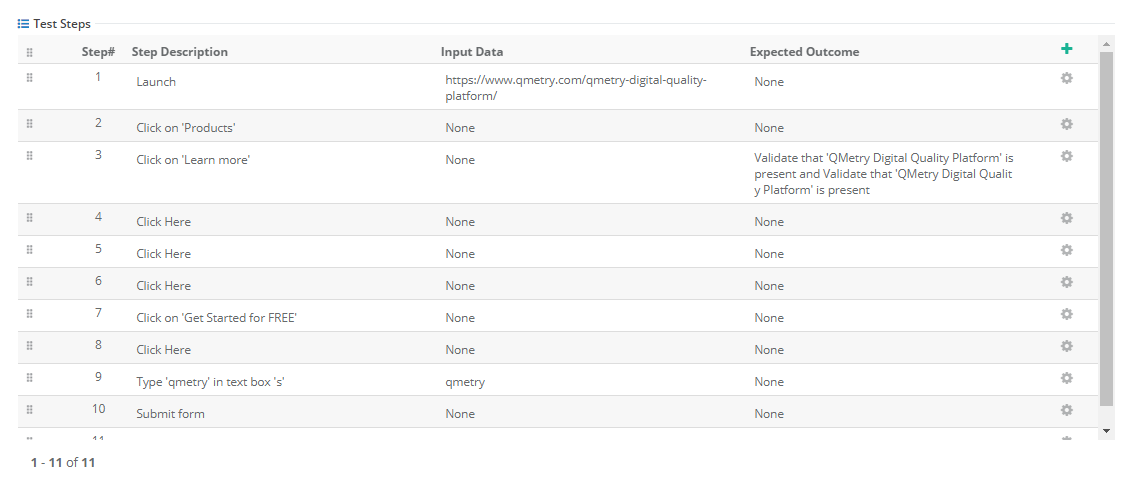
Document
Your each and every event on the website are recorded in the form of test steps.
The Document tab displays Screen Shot thumbnails with its Step Details, Input Data and Expected Output. The recording creates automated documentation that you can read and interpret easily.
Step Details is your action you perform, Input Data is the website you are exploring and Expected Output is an Assertion that you supplied while recording the session.
All the things are captured in the form of text and described as documentation.
...
Step Details, Input Data and Expected Output fields are editable. You can modify the field values as per requirement.
Export Session Details
Users can export individual session details in Word document. The following details of the session will be exported:
Session Summary, Notes, Metadata information
Defects Summary
Document tab Details: Step Description, Input Data, Expected Outcome, attached Screenshots
Steps
1. Open the exploratory session you want to export the details of.
2. Click on the paper icon at the top right corner of the session screen.
...
Event Detail
The Event Detail tab displays event details of each event carried out during recording the session.
There are three vertical panels adjacent to each other:
First panel displays events in sequence.
Second panel displays image for the even selected in the first panel.
Third panel displays Property and Value for the event selected in the first panel.
...
Defects
The Defects tab displays bugs that you logged while recording the session. This bug is logged in the Issue module of QMetry Test Management.
To open the issue detail page, click on the Entity Key that opens the issue in the Issue module.
...
Console Logs & Network Logs
You can capture browser Console and Network logs for a session that are helpful for developers to debug failed scenarios. The Console and Network events recorded during the session will be displayed on the Console and Network Tab for that session. These logs will also be added as attachments to the test case created from the session.
Before starting the session recording if you have selected the option to record Console Logs and Network Logs, then the following two tabs will be displayed with relevant logs attached.
Console Logs
Console Logs will be recorded only if there are any exceptions occurred. Open the Console Logs tab.
...
Network Logs
Open the Network Logs tab.
...
Console Logs and Network Logs are attached to the test case that is created from the session. Refer to the Create Test Case from Recorded Session below for details on creation of test case.
...
Create Test Case from Recorded Session
Users can create test cases in QMetry from the sessions recorded during exploratory testing. It saves time as users get automated test cases without writing them manually.
Test case created from an exploratory session can now be linked to Requirements & Test Suites from the Exploratory testing screen. The workflow allows testers to execute the test case by associating it to a test execution from within the session as an evidence of the tested use case.
Pre-requisites: User should have Test Case module "Create" rights and Exploratory Testing "View" rights.
Go to Automation > Exploratory Testing.
Open the session you want to create test case from. You can see the Create Test Case option at top right corner.
...
It opens Create Test Case screen with QMetry fields on it.
Session Name is populated as Summary.doc
...
Events are populated as Test Steps.
...
Images captured during the session are available as attachments with corresponding test steps.
Link Requirement to Test Case
You can link requirements to the test case while creating test case from the session.
Click on the Link button.
Select the requirements on the screen that opens next. You can also link requirements from across projects.
...
Created test case will show up in the Test Case module.
...
Requirements linked to the test case are seen on the Requirements tab.
...
Create Test Execution from Recorded Session
The workflow now allows testers to execute the test case by associating it to a test execution from within the session as an evidence of the tested use case.
Note: If the project has the eSignature feature (Approval Workflow and Part 11 Compliance) enabled, then the Create Test Execution button will be disabled.
Go to Automation > Exploratory Testing.
Open the session you want to create test execution for.
Click the Create Test Execution option at top right corner.
...
Step 1. Create Test Case
The first step towards creating test execution is to Create Test Case.
On the Create Test Case screen with you would find QMetry fields.
Session Name is populated as Summary and Events are populated as Test Steps. Fill the test case details.
...
Link Requirement to Test Case: You can link requirements to the test case.
Click on the Link button.
Select the requirements on the screen that opens next. You can also link requirements from across projects.
...
Click Next.
Step 2. Create Test Suite
The second step is to Create Test Execution.
Clicking on the Next drop-down displays two options: (A) Create Test Suite (B) Link Test Suites
...
(A) Create Test Suite
On the Create Test Suite screen, you would find test suite related fields.
You must link at least one release and cycle to the test suite for execution.
Link Platform to the test suite.
Then click Next.
...
The confirmation message pops up. Click Yes to proceed.
...
(B) Link Test Suites
If you want to link existing test suites to the test case, then select this option.
Select test suite and click Next.
...
The confirmation message pops up. Click Yes to proceed.
...
After creating a test suite or linking existing test suite to the test case, execute the test suite.
Step 3. Execute
The last step is to execute the test suite on the linked platforms. All the bugs that are linked to the exploratory session will be automatically linked to all the executions that are being created.
The Create Test Execution screen displays combination of test suites against release and cycles along with associated platforms.
Select a build for which the test suite is to be run and select the Execution Status.
Once you are done executing the test suites, click Finish.
...
You can see the created test suite in the Test Suites module.
...
The test suite entity key has link on it. Clicking on the link opens the Test Execution tab where you can see the test suites executed in the Exploratory Testing module.
...
| Child pages (Children Display) |
|---|