...
Step 2: Open Chrome from the shortcut and reproduce the issue. The dev tool will get open automatically for every new tab/window.
Save HAR/Network Logs:
Go to Network > Reproduce the issue.
Right-click on the output window > Click on "Save as HAR with Content".
Save Console/Browser Logs:
Right click on the output window > Enable Log XMLHttpRequests > Reproduce the issue.
Again, right-click on the output window > Click on "Save as".
For Firefox Browser:
From the Settings, go to Web Developer and select "Browser Console" from the Web Developer submenu in the Firefox Menu (or Tools menu if you display the menu bar).
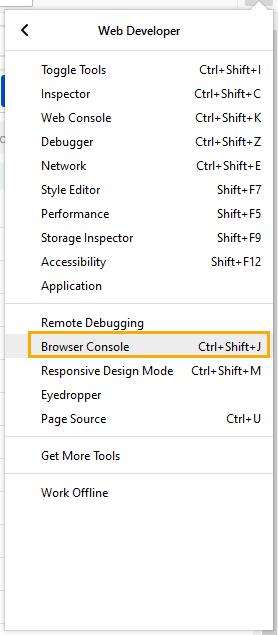
To access directly from the keyboard: press Ctrl+Shift+J.
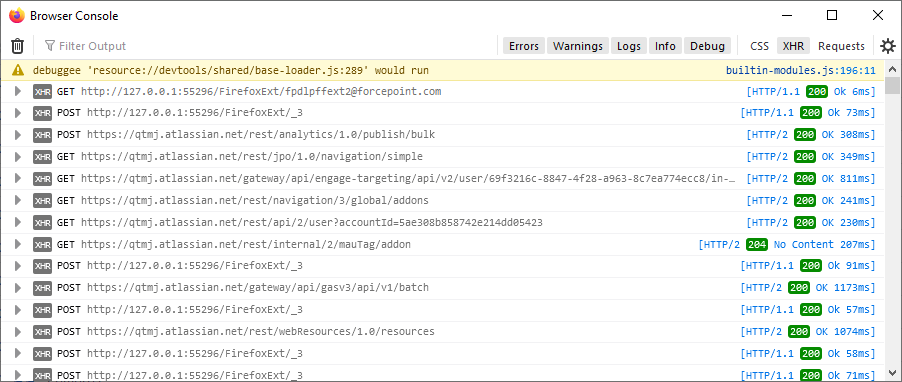
Save HAR/Network Logs:
Enable XHR/CSS/Requests tabs > Reproduce the issue.
Right-click on the output window > Click on ‘Export visible message to' and select 'File’
Save the file and send it to QMetry Support.
...
Save Console/Browser Logs:
Enable the Errors/Warnings/Logs/Info/Debug tabs > Reproduce the issue.
Right-click on the output window > Click on ‘Export visible message to' and select 'File’
Save the file.
If you have any queries, kindly contact QMetry Support.
...