...
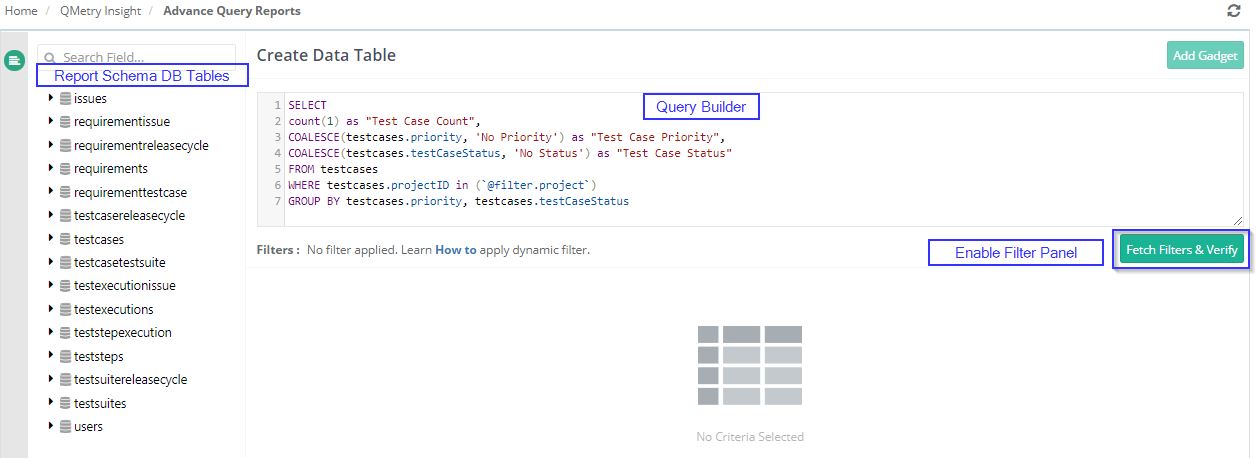
Go to: QMetry Insight > Advance Query Reports.
Create a Query using Query Builder.
You can use the search box to search the field quickly on the list.
Click on the Fetch Filters & Verify button to enable the filter panel.
Apply required Filters to the fields and click on Run Query to generate the report.
It gives output in tabular format. You can modify the output format by switching to the available chart types from the table. In our case, we will switch it to the Bar Chart.
Report: A bar chart showing the Count of the test cases by status over priority. (Name: Count Of Test Cases By Status Over Priority).
Once you get your desired report, you can save the report as a Gadget by clicking on the Add Gadget button.
Once you save the gadget, it will be available in the QMetry Custom Gadget section > My Gadget tab.
...


