This report is introduced after QMetry version 1.70.
Introduction
This Executive Coverage Report shows what percent of issues have one or many test cases associated.
The report consists of three charts: Story Coverage, Test Run Coverage of selected stories and Defect Coverage of selected stories.
Configure Executive Coverage Report
Selection of Stories
In case you have not selected any story to generate the report, then the message displays with a link that opens the list of stories to select from. On the basis of stories selected here, the report will be generated. You can always modify the scope by clicking on the Modify Story Scope button at top.
...
Open QMetry menu > View Reports > Executive Coverage Report.
Click on the Configure button at top right.
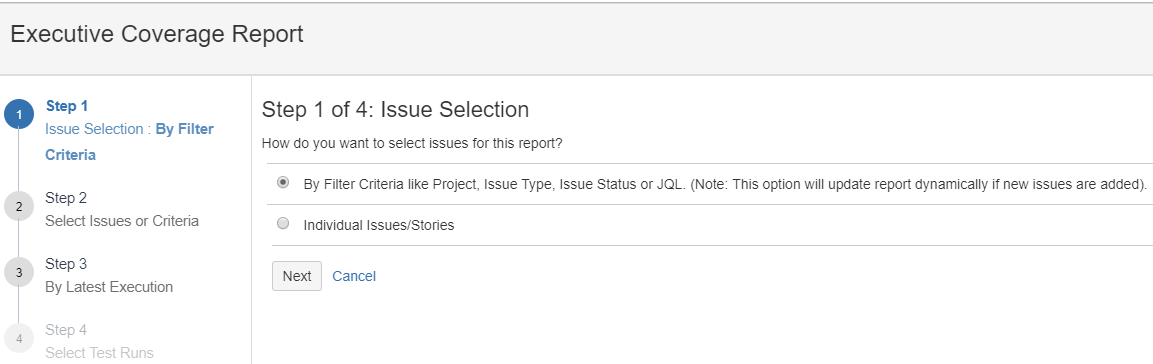
Step 1 Issue Selection
(A) By Filter Criteria like Project, Issue Type, Issue Status or JQL. Apply different filter or write JQL query to construct issue selection criteria.
Note: This option will update report dynamically if new issues are added matching the selection criteria.
To search for issues with specific criteria, you can apply either Basic Search or Advanced Search.
Basic Search:
- Project
- Issue Type
- Status
- Search By: You can search issues either with Issue Key or with Summary. Just select the parameter and enter value in the adjacent search box.
Advanced Search:
You can use JQL to write the search query and get preferred issues as per the criteria.
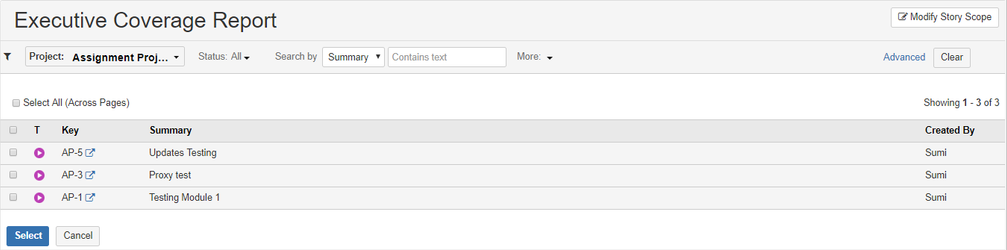
(B) Individual Issues/Stories
Check box will be available to select individual issues as per your preference.
Step 2 Select Issues or Criteria
If you have selected (A) above, then apply a filter and click Next.
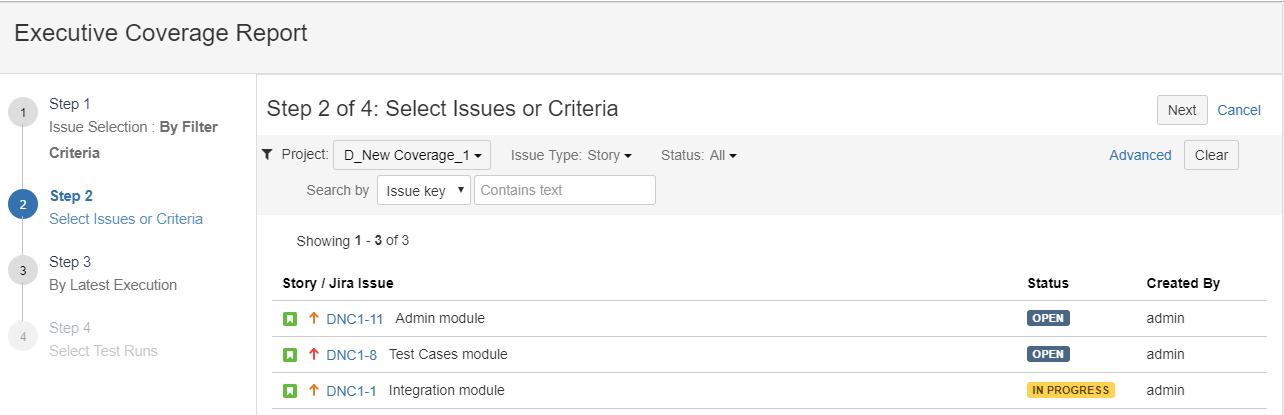
If you have selected (B) above, then select individual issues by selecting the check box. Even you can apply filter here and then select required issues.
Step 3 Latest Execution Result
Are you interested in knowing only latest execution results of Test Cases?
- Yes: Select "Yes" if you want to generate report that includes only latest execution results of test cases, then select "Yes" and click on the Generate Report button.
Latest execution of test case is considered for calculating execution coverage and defect coverage of selected stories.
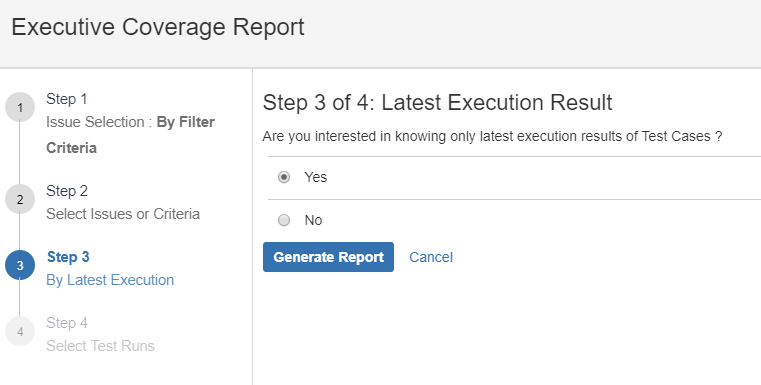
- No: Select "No" if you want to choose different Test Runs. If you select "No", then the next Step 4 is enabled that lets you select test runs to generate the report.
Step 4 Select Test Runs
Step 4 is visible once you select "No" in Step 3 above.
Select test runs, that you want to generate the report for. You can apply filters to narrow down your search.
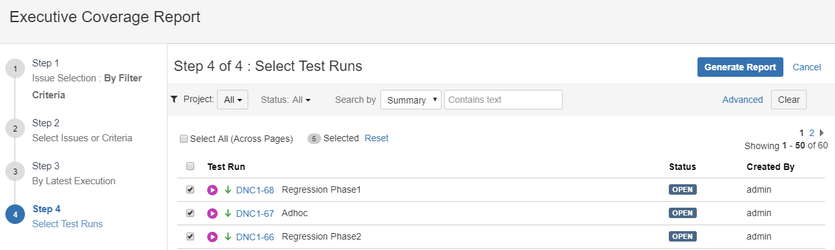
Multiple options are available to filter
...
test runs and select the required ones.
Basic Search: You can filter the search records with the following filters -
- Project
- Issue Type
...
- Search by: Summary / Issue Key
...
Advanced Search
You can use JQL for searching stories. QMetry supports auto-complete JQL in the field. Read more about JQL syntax and how to use JQL for search.
Select test runs you want to include in report and click on the Generate Report button at the top right.
On the basis of test runs selected here, the report will be generated.
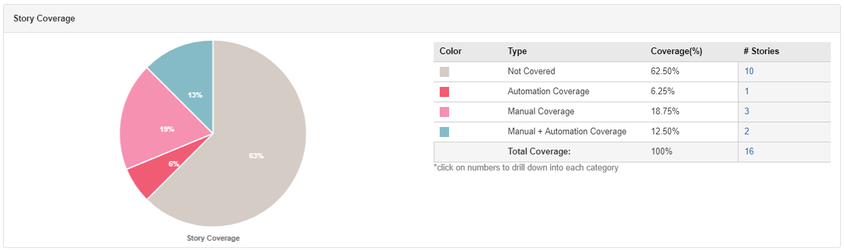
Story Coverage
The pie chart displays Story Coverage based on test cases within the selected stories. It provides details of stories bifurcated on the basis of types of test cases within it.
...
...
Not Covered: It refers to Stories which
...
don’t have any test case within it.
Manual Coverage: It refers to Stories which have Manual test cases within it.
Automation Coverage: It refers to Stories which have only Automation test cases within it.
...
Manual + Automation Coverage: It refers to Stories which have Manual as well as Automation test cases within it.
The stories counts are clickable.
...
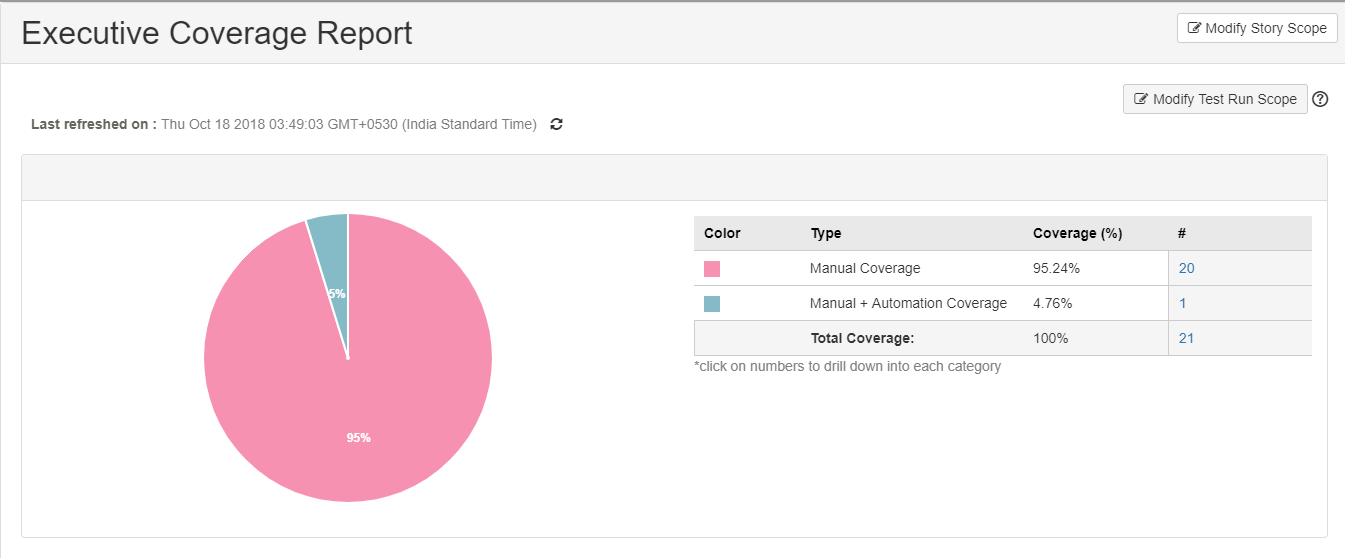
You can drill down each category and view contents of the stories covered in the category.
You can open individual Story page in JIRA.
Export Story Coverage Report
You can drill down to individual category and export the details related to that category into Excel file.
Click on the Export button to export the report details.
...
Test Run
...
By default, latest test run for the test case is considered for calculating test run and defect coverage of selected stories. For example, one of the stories are executed in different three test runs. So, the latest test run for that story will be considered to calculate the statistics. Otherwise, the report is generated for the Test Run Scope you define.
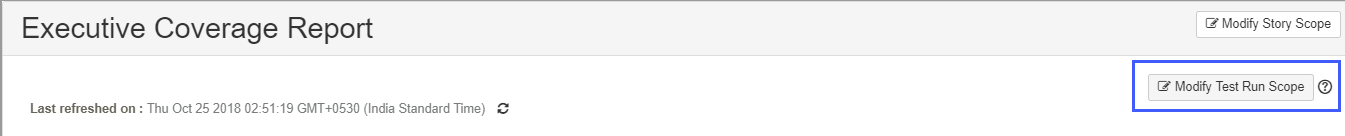
If you want to choose different Test Run not latest one, then you can modify Test Run Scope option.
...
It displays test runs which contain stories you selected above.
Select test runs you want to generate the report for. Multiple options are available to filter test runs and select the required ones. Basic Search and Advanced Search are available to apply different criteria for search. Refer to Selection of Stories above.
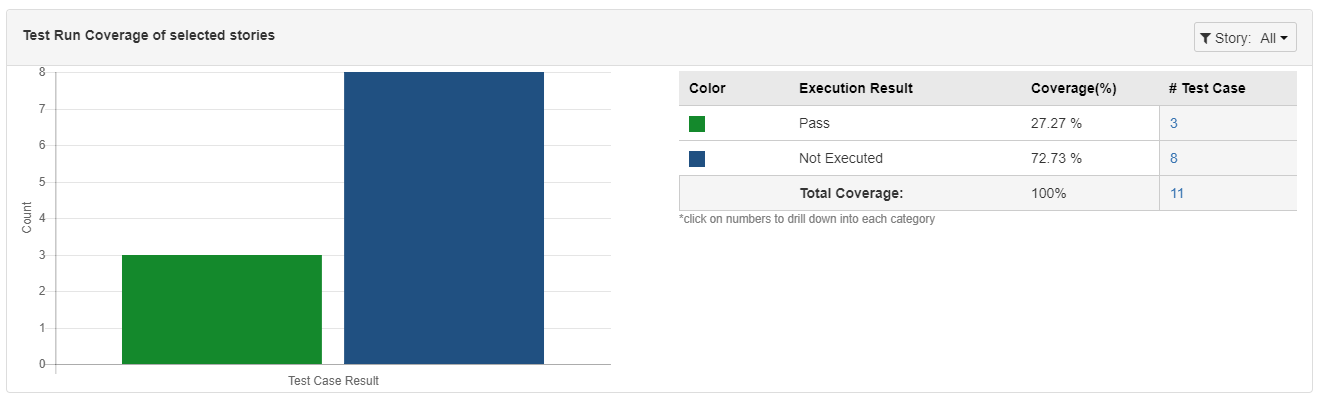
Test Run Coverage
Coverage of Selected Stories
Once you select the test runs as described above, you can view the Test Run Coverage report. The bar chart displays count of test case execution results of test cases covered under stories.
...
...
Once you generate the report, you can see that the counts in the table are clickable.
...

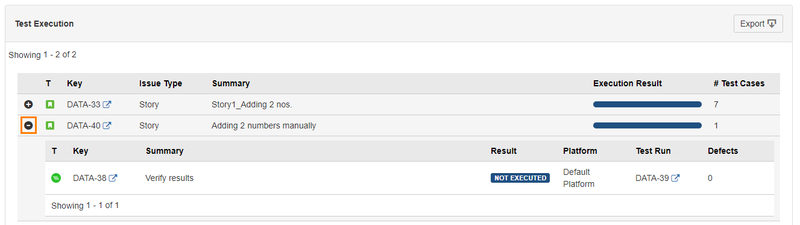
You can drill down each Execution Result and view contents of the test cases covered in the Execution Result.
You can open individual Story page in JIRA.
The records are expandable. You can drill down further from stories to test cases.
Export Test Execution Report: You can drill down to individual category and export the details related to that category into Excel file.
Clicking on the Export button to export the report details.
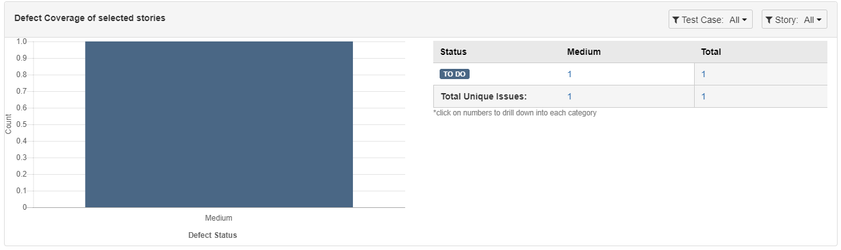
Defect Coverage of
...
Selected Stories
Test Run
The bar chart displays Priority wise count of defects logged during the test runs. Once you select
...
stories as described above, you can view the Defect Coverage of selected
...
Stories report.
...
...
...
You can filter the report further by its Story Coverage and Test Case Status. Select required option on the Story and Test Case drop-down menus above the chart.
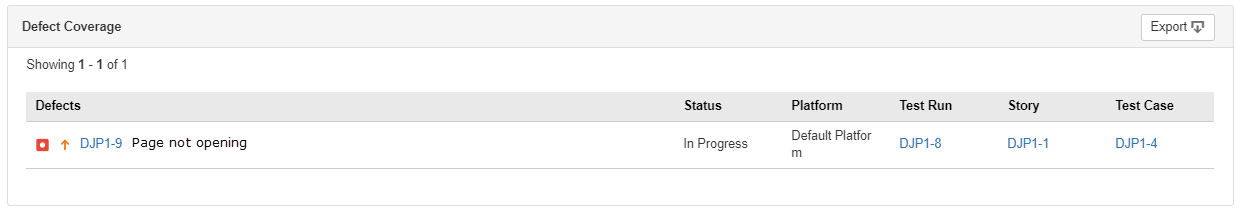
The counts in the table are clickable. You can drill down each Priority and view contents of the defects (bugs) covered in the test run.
You can open individual defect page in JIRA.
...
...
You can view the complete hierarchy of association –> Bug – Test Run – Story – Test Case.
Export Defect
...
Coverage Report: You can drill down to individual category and export the details related to that category into Excel file.
Clicking on the Export button to export the report details.
Syncing Report Data
Click on the Refresh icon at the top to sync the report data with data updated in JIRA. The data of stories and test runs, which you selected to generate reports, are updated with the latest changes. The report is generated anew with the updated data.
...