...
The following features are common across the System Reports.
| Table of Contents |
|---|
Export System Reports & Gadgets
Export System Reports as PDF
...
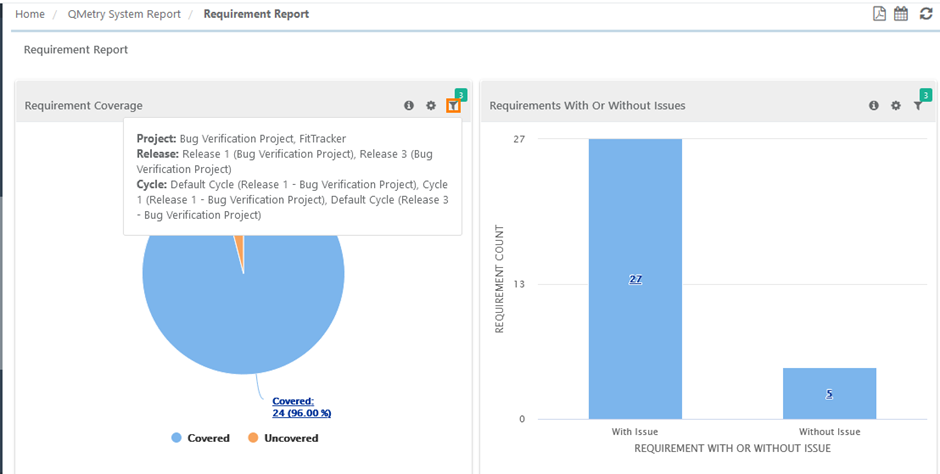
 | Hover over the icon to know the definition of the gadget. |
 | Click on the Filter icon on the individual chart to generate the report as per requirement by applying multiple filters. The filters you applied on the reports can be viewed on hover over the filter icon in the gadget. The filter count is also displayed.
|
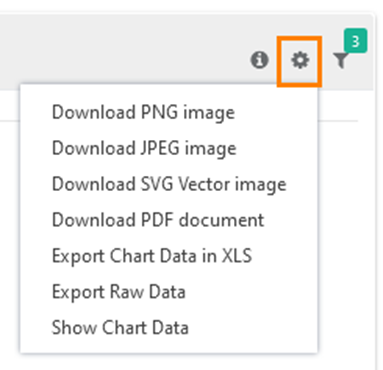
| Click on the Cog icon and you have multiple options to download and export the individual gadget details.
|
Download PNG image | This option is valid for graphical reports like bar chart, pie chart, column chart, etc. The report will be exported in PNG format. |
Download JPEG image | This option is valid for graphical reports like bar chart, pie chart, column chart, etc. The report will be exported in JPEG format. |
| Download SVG image | This option is valid for graphical reports like bar chart, pie chart, column chart, etc. The report will be exported in SVG format. |
| Download PDF document | This option is valid for graphical reports like bar chart, pie chart, column chart, etc. The report will be exported in PDF format. |
Export Chart Data in XLS | The report data will be exported in tabular form. |
| Export Raw Data | The report displays data using which the graph has been generated. |
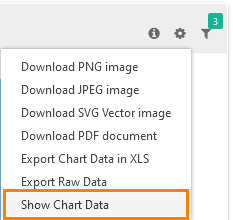
| Show Chart Data | The option displays report data in tabular form in the same gadget panel. The view (Graph/Tabular) you select for the report is preserved for it until you change the view.
The data is displayed in the tabular format like below.
|
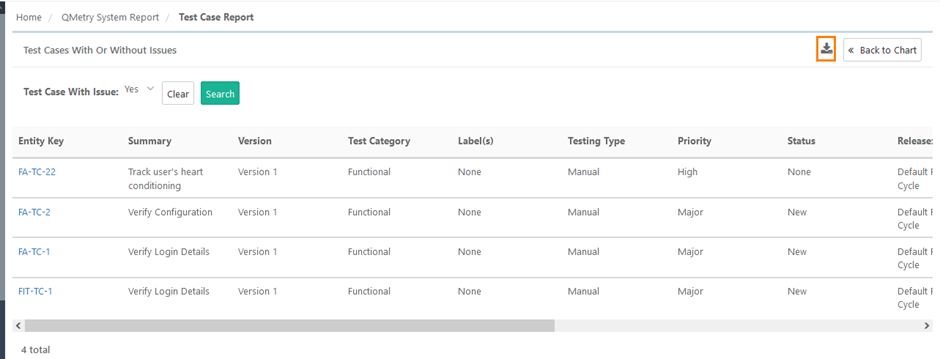
| Export of Drilled Down Chart | You can view the tabular format of the graphical representation. You can drill down the chart by clicking on the required portion/bar of the chart. It displays the details in table - rows and columns. To download the report in CSV, click on the download icon at top right. Then check the Scheduled Task section from where you can see the progress and download the report.
|


Schedule System Reports
The system report can be scheduled one time/recurring as email notifications. To schedule outbound emails at a particular frequency, click on the Schedule button for the report that you want to share. The report details will be sent in PDF to recipients as per the defined schedule. The PDF containing graphical as well as tabular reports will be emailed using Scheduled Report.
The scheduler  icon is provided on the report header. Clicking on this icon opens a screen with the two tabs:
- Schedules: The tab shows a list of scheduled reports.
- Schedule Report: Template to schedule reports.
Note: The following system reports cannot be scheduled:
- Top Issues Report
- Traceability Report
- Test Result Log Report
- Platform Report
- Release Cycle Report
Scheduling System Reports
The report details will be sent in PDF to recipients as per the defined schedule. The email recipients could be outside the QMetry instance.
Open the Schedule Report tab. It opens a template to fill in the details and schedule the emails to be sent as notifications along with the report in PDF.
...
Once you are done entering the details, click Submit to schedule the report. The report will be sent as per the set date, time, and frequency.
To send the email instantly, click Run Now.
...