...
 | Hover over the icon to know the definition of the gadget. |
 | Click on the Filter icon on the individual chart to generate the report as per requirement by applying multiple filters. The filters you applied on the reports can be view on hover over the filter icon in the gadget. The filter count is also displayed. 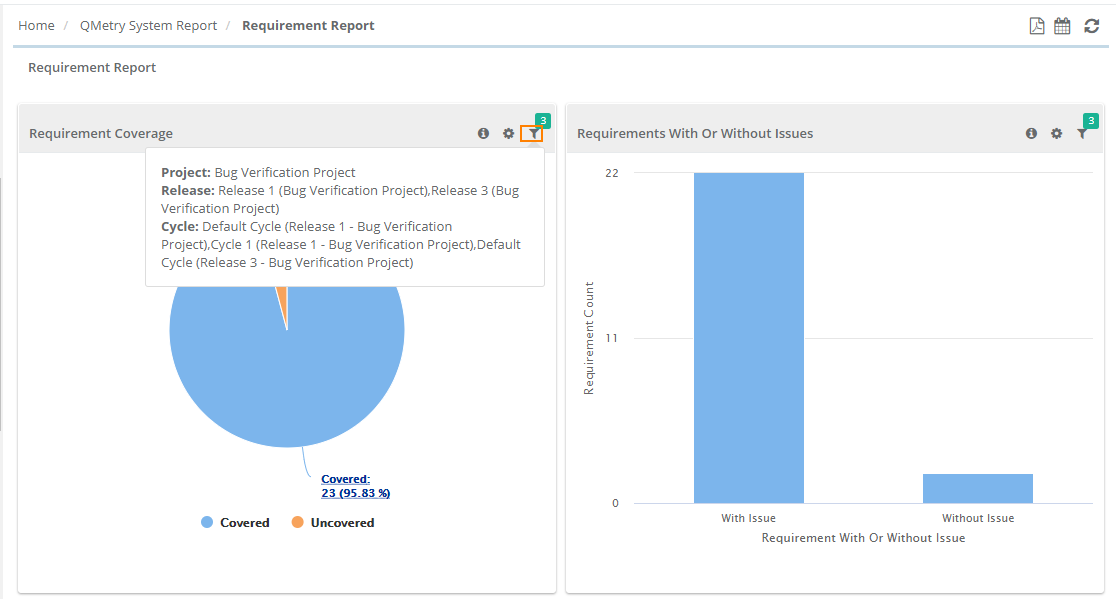 |
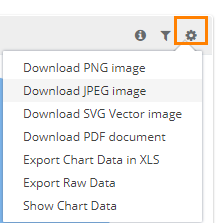
| Click on the Cog icon and you have multiple options to download and export the individual gadget details.
|
Download PNG image | This option is valid for graphical reports like bar chart, pie chart, column chart, etc. The report will be exported in PNG format. |
Download JPEG image | This option is valid for graphical reports like bar chart, pie chart, column chart, etc. The report will be exported in JPEG format. |
| Download SVG image | This option is valid for graphical reports like bar chart, pie chart, column chart, etc. The report will be exported in SVG format. |
| Download PDF document | This option is valid for graphical reports like bar chart, pie chart, column chart, etc. The report will be exported in PDF format. |
Export Chart Data in XLS | The report data will be exported in tabular form. |
| Export Raw Data | The report displays data using which the graph has been generated. |
| Show Chart Data | The option displays report data in tabular form in the same gadget panel. |
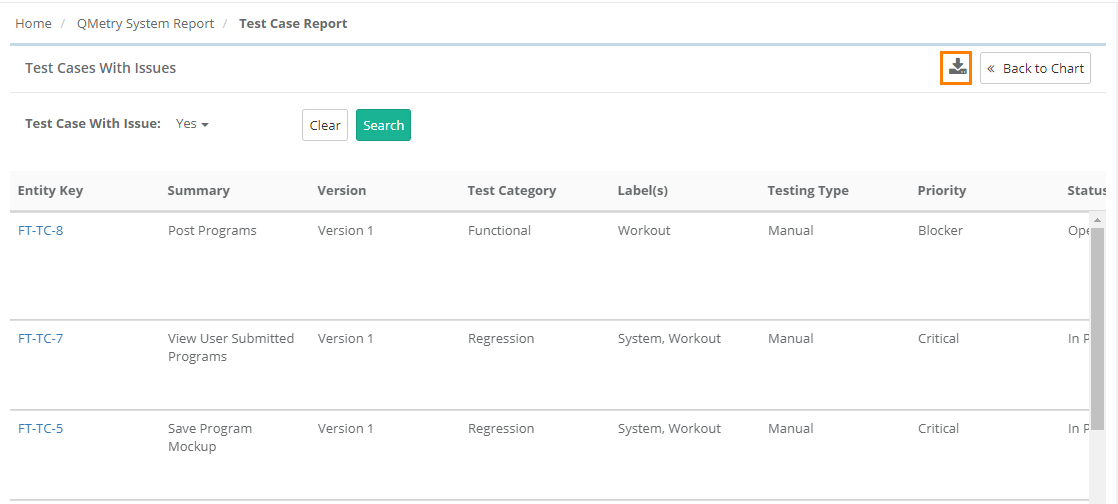
| Export of Drilled Down Chart | You can view the tabular format of the graphical representation. You can drill down the chart by clicking on the required portion/bar of the chart. It displays the details in table - rows and columns. To download the report in CSV, click on the download icon at top right. Then check the Scheduled Task section from where you can see the progress and download the report.
|

...