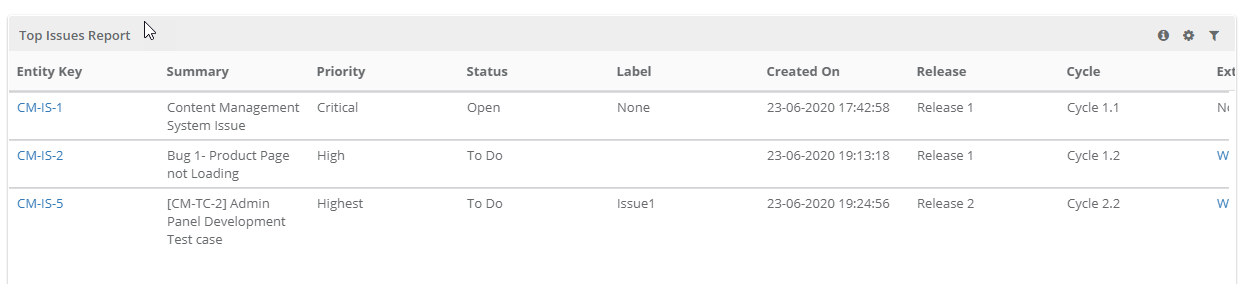
The report shows the top defects affecting the most test cases created over a period of time for the current Project. It displays the defects which are linked maximum times with test cases. The defect type should be "Bug".
The Usages count on the report indicates the number of times that particular defect is linked with test cases.
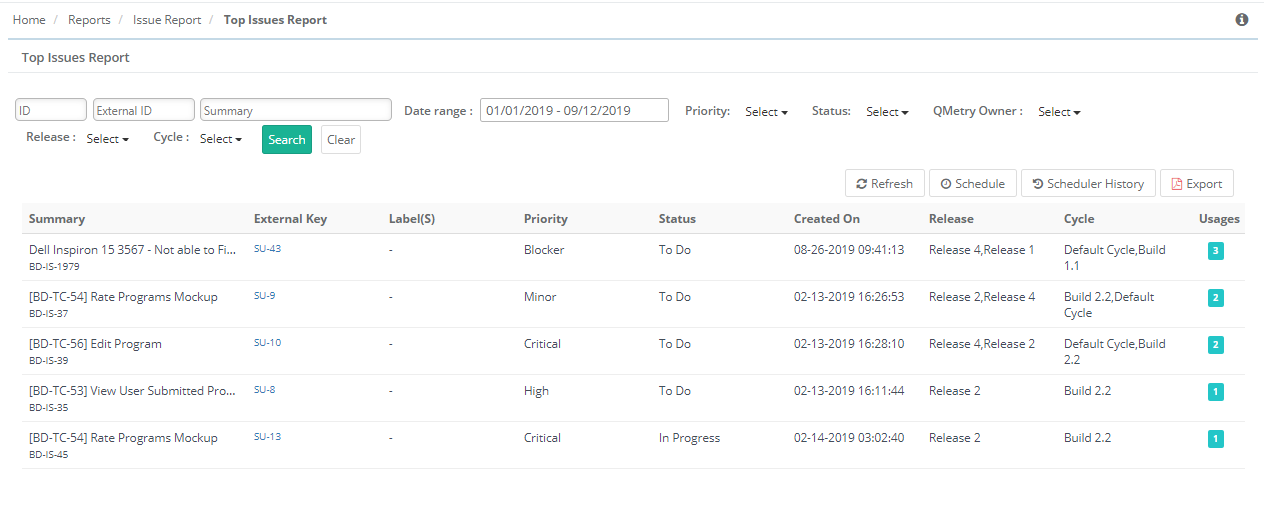
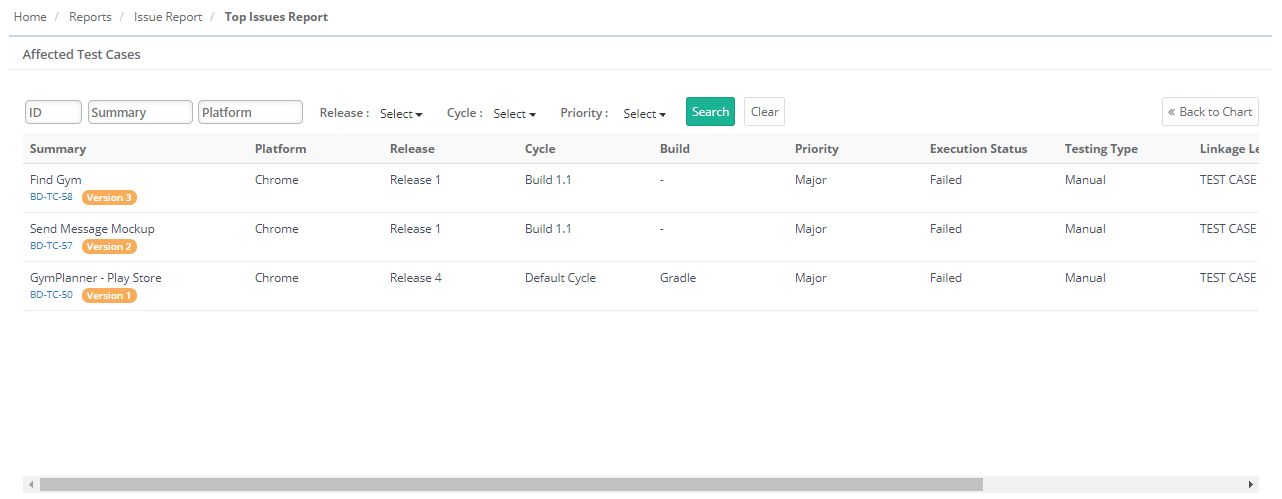
The Usages count is clickable, clicking on which opens the list of Affected Test Cases.
...
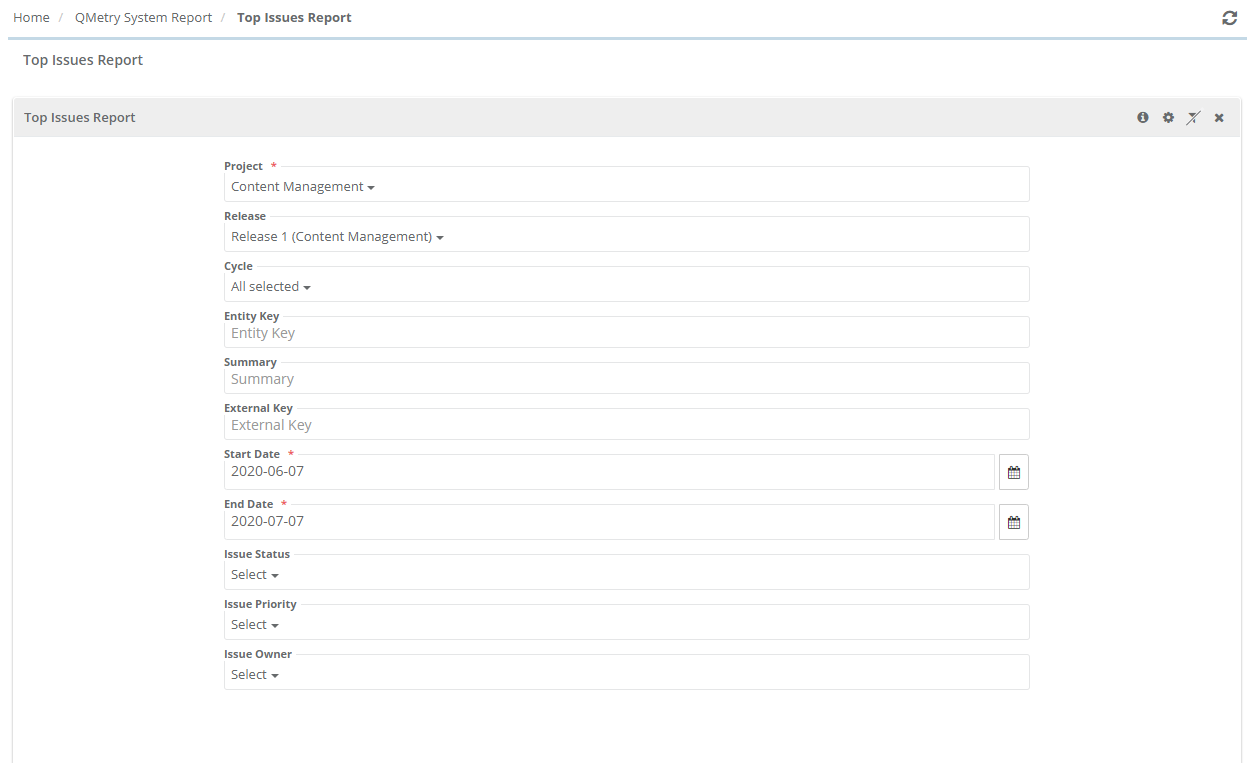
Filter the Report
Click on the Refresh icon at the top to sync the report data with data updated in QMetry Test Management. The report is generated anew and you can view reports with real-time data.Filter icon on the individual chart to generate the report as per requirement by applying multiple filters.