Test case report provides standard industry matrices used by QA managers & Testers to get a summarized view on test automation coverage, execution coverage, test cases affected with a bug for a combination of Project, Release, and Cycle. The summary graphs can drill further to get the details of test cases. The fields/columns can be grouped, sorted, selected (show/hide), resized. The graphical report can be exported in Pdf or Png formats and drilled down details can be exported in Excel or CSV format. The report can be generated for multiple projects.
| Table of Contents |
|---|
Test case reports show the following matrices :
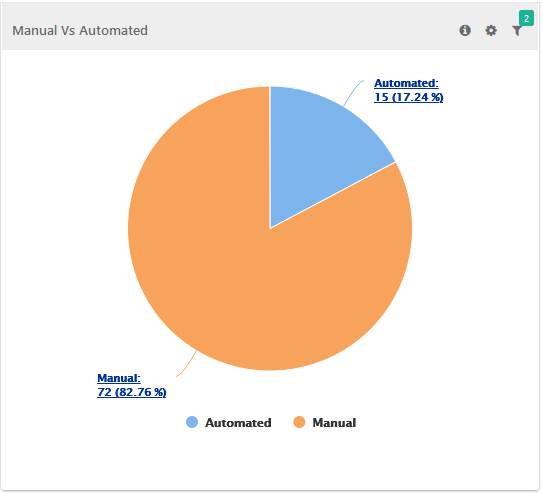
Manual Vs Automated
The report shows a summary of Manual vs Automated test cases based on testing type. Testing type is decided based on how a test case is created in QMetry. Test cases that are created/imported (via excel) using QMetry UI will have type as "Manual". Test cases that are created through Automation will have type as "Automated".

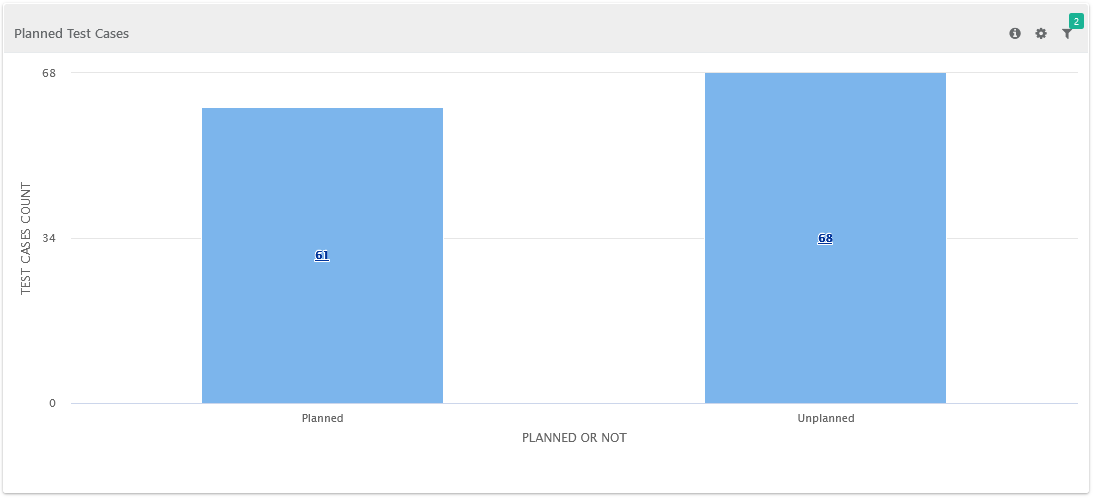
Planned Test cases
The report shows summary of test case planned or unplanned for execution. Test case those are linked with test suites are "Planned" for execution. Test case those are not linked with test suites are considered "Unplanned" for execution.

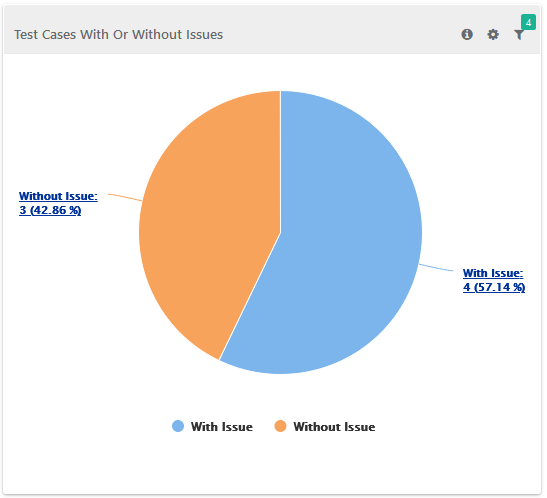
Test cases with/without Issues
The report shows a the summary of Test test cases associated with issues captured during execution and also test cases with which issues are not linked during execution. The report can be filtered based on the combination of the Release and Cycle. The issue issues linked at the test step level is are not considered for this report.

Test
...
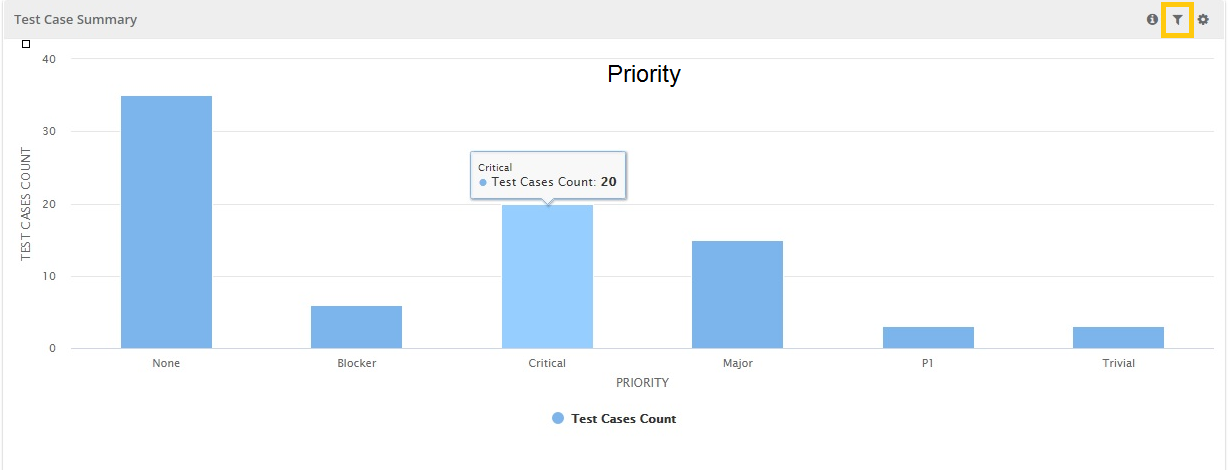
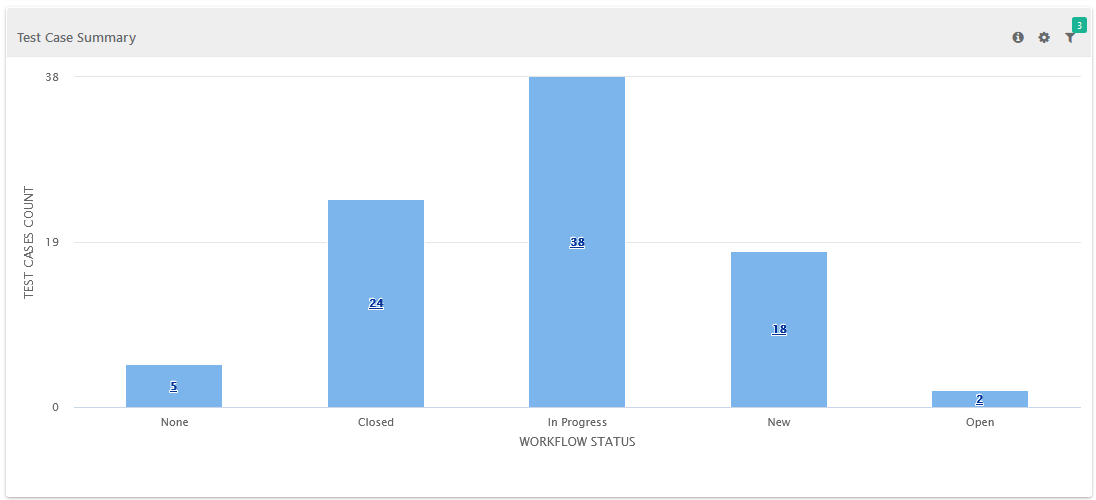
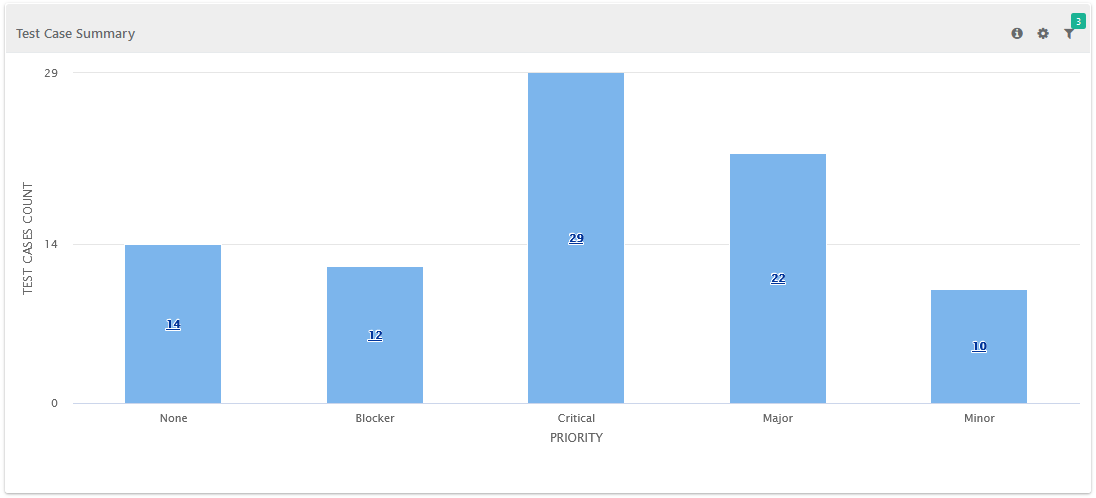
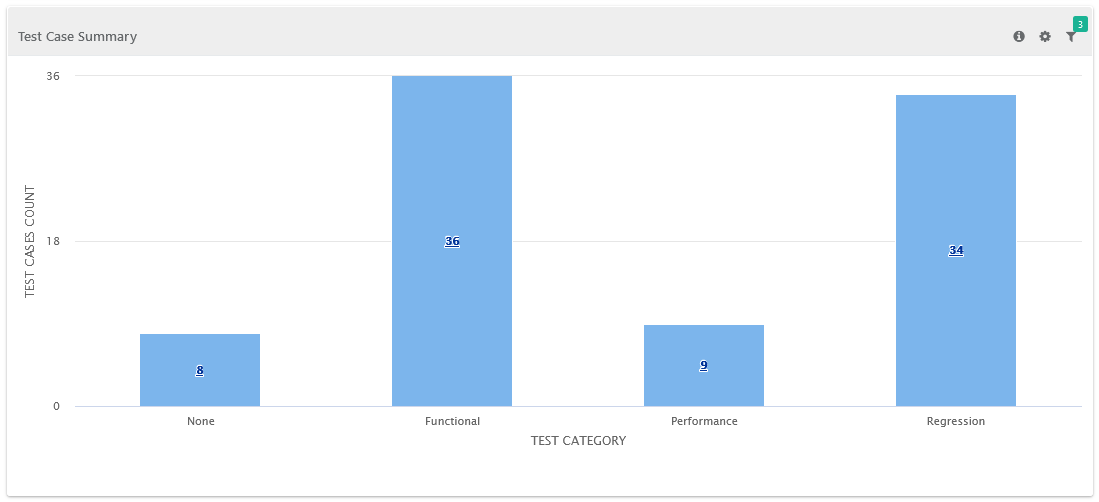
Case Summary by Workflow Status/Priority/Test Category
The report shows a the summary of test cases grouped by their workflow status/priority/test category.

Test Case Summary by Workflow Status
Test Case Summary by Priority
Test Case Summary by Test Category
Download Chart
You can see the Cog icon button over the individual charts. The download functionality makes it easier for users to save charts as images with different formats.

