| Table of Contents |
|---|
...
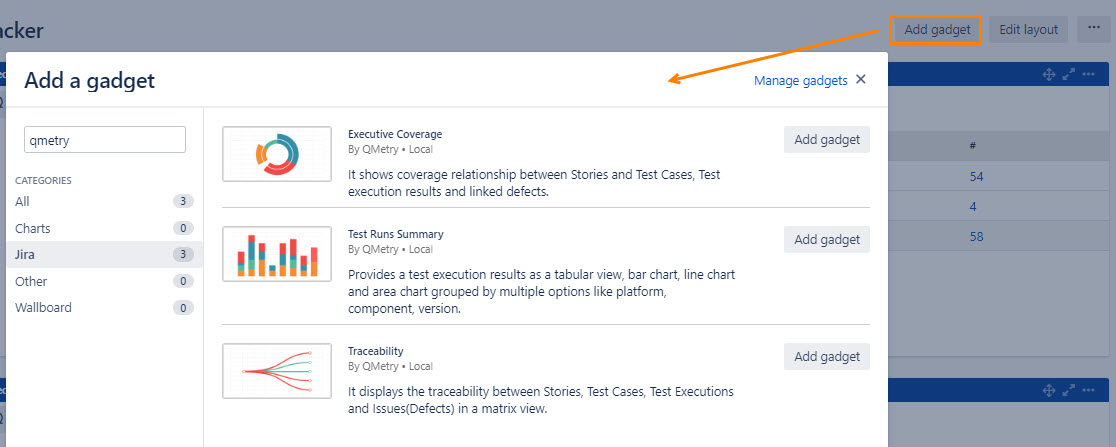
3. Select either of the following gadgets to add on the dashboard by clicking on the corresponding Add gadget button.
- Executive Coverage
- Test Runs Summary
- Traceability

Generate Graphs using Gadget
...
The report provides a test execution results as a tabular view, bar chart, line chart and area chart grouped by multiple options like platform, component, version.
Go to Dashboard and click on the Add Gadget button.
Select Test Run Summary to add as a gadget on your dashboard.
The Test Run Summary gadget looks like below. You can configure different graphs using different criteria.
...
This new filter is added to generate report considering data of last particular days. By default it is 30 days, which you can change as required.
For Example,
You enter 15 days here, then the reports will be generated on the basis of data of last 15 days.
Types of Views
Test Run Summary gadget provides the following views. Each view has its own pattern to represent the data which helps you compare results between different groups or track changes over a period.
...