| Table of Contents |
|---|
Introduction
For the selected Project, the Executive Coverage Report shows what percent of issues have one or more test cases associated. The report displays test coverage as well as overall testing quality. The coverage data is based on the stories you selected as well as the test runs.
The report consists of three charts: Story Coverage, Test Run Coverage of selected stories and Defect Coverage of selected stories.
Configure Executive Coverage Report
Open QMetry menu > View Reports > Executive Coverage Report.
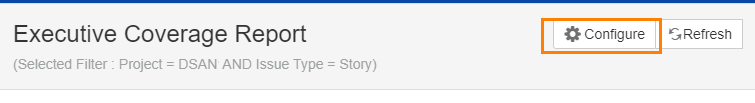
Click on the Configure button at top right.
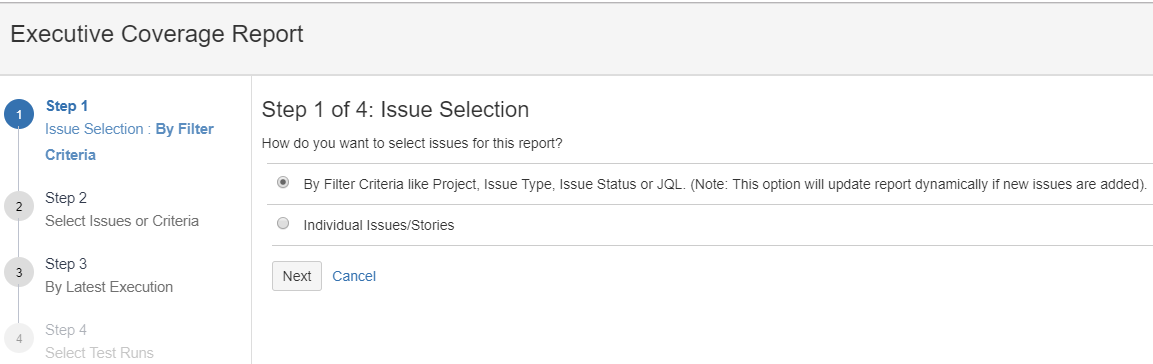
Step 1 Issue Selection
(A) By Filter Criteria like Project, Issue Type, Issue Status or JQL. Apply different filter or write JQL query to construct issue selection criteria.
Note: This option will update report dynamically if new issues are added matching the selection criteria.
Once the query/criteria is constructed for issue selection, users need not to bother about writing new queries/criteria to take care of any changes/addition/removal of issues. It will be taken care of automatically.
To search issues with specific criteria, you can apply either Basic Search or Advanced Search.
...
(B) Individual Issues/Stories
Check box will be available to select individual issues as per your preference.
Step 2 Select Issues or Criteria
If you have selected (A) above, then apply filter and click Next.
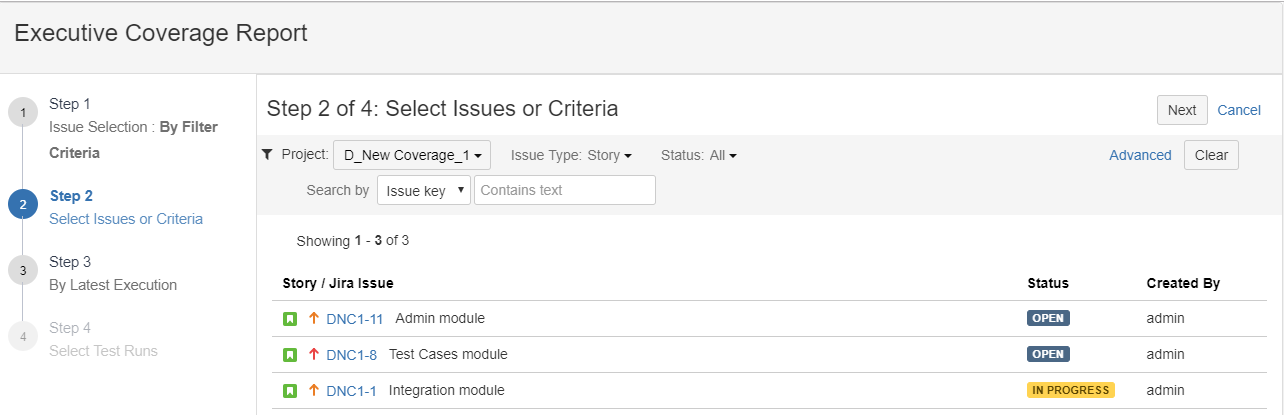
If you have selected (B) above, then select individual issues by selecting the check box. Even you can apply filter here and then select required issues.
Step 3 Latest Execution Result
Are you interested in knowing only latest execution results of Test Cases?
- Yes: Select "Yes" if you want to generate report that includes only latest execution results of test cases, then select "Yes" and click on the Generate Report button.
Latest execution of test case is considered for calculating execution coverage and defect coverage of selected stories.
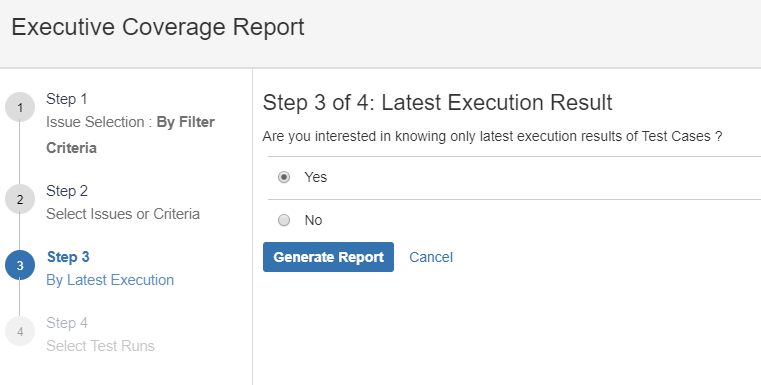
- No: Select "No" if you want to choose different Test Runs. If you select "No", then the next Step 4 is enabled that lets you select test runs to generate the report.
Step 4 Select Test Runs
Step 4 is visible once you select "No" in Step 3 above.
Select test runs, that you want to generate the report for. You can apply filters to narrow down your search.

Multiple options are available to filter test runs and select the required ones.
...
You can use JQL for searching stories. QMetry supports auto-complete JQL in the field. Read more about JQL syntax and how to use JQL for search.
Select test runs you want to include in report and click on the Generate Report button at the top right.
On the basis of test runs selected here, the report will be generated.
Story Coverage
The pie chart displays Story Coverage based on test cases within the selected stories. It provides details of stories bifurcated on the basis of types of test cases within it.
...
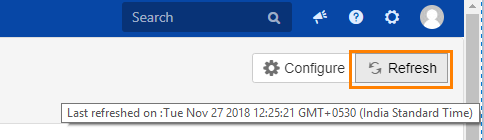
On hover, the Refresh button displays the details of when the report was viewed refreshed last.