Execution Summary report provides standard industry matrices used by Product Managers, QA managers & Testers to get a summarized view on test executions & issues found during execution for combination of Project, Release, Cycle and Type.
Test Suite Execution Summary by Status: The report displays execution summary of the test suites based on execution status of its test case runs.
Platform Summary By Test Suites: The report displays execution summary of the test case runs for a combination of Platform and test suites.
The report can be generated by applying filters Project, Release, Cycle, Start Date, End Date.
The report includes summary of archived test case executions.
For eSignature enabled projects, the report shows count for Approved, In Review, Closed execution status.
The report can be generated for multiple projects. You can select more than one project on the drop-down.
If only Project is selected (without Release and Cycle), then the latest version of test case will be considered in the report.
If Release/Cycle is selected along with Project, then the test case version associated to that Release and Cycle will be considered in the report.
Execution Summary reports show the following matrices. The reports display chart colors matching with the execution status colors in Customization > Execution Status.
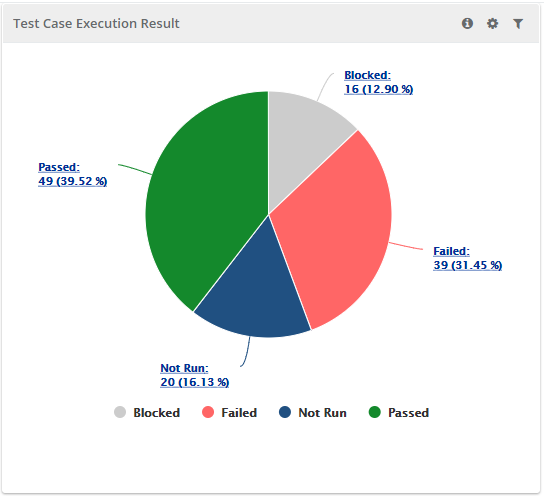
This report shows summary based on test execution results.
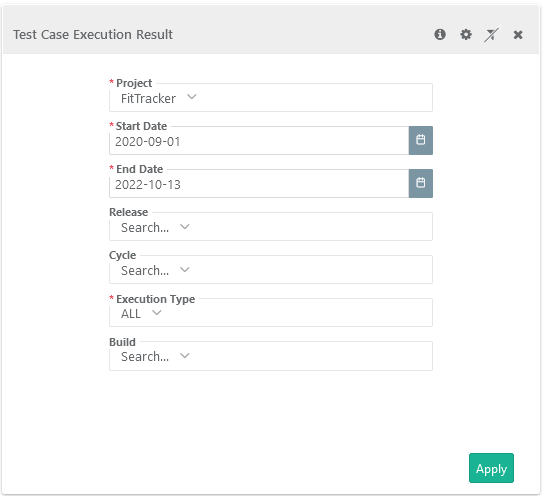
Filter Report:
Click on the Filter icon on the individual chart to generate the report as per requirement by applying multiple filters.
Start Date and End Date are based on Test Execution Run Creation Date.
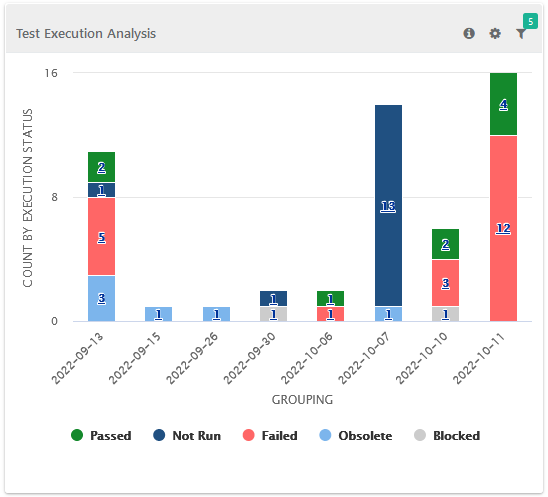
This report shows summary of test case executions grouped Day/Week/Month and Execution Status. This report graph can be filtered by day/week/month.
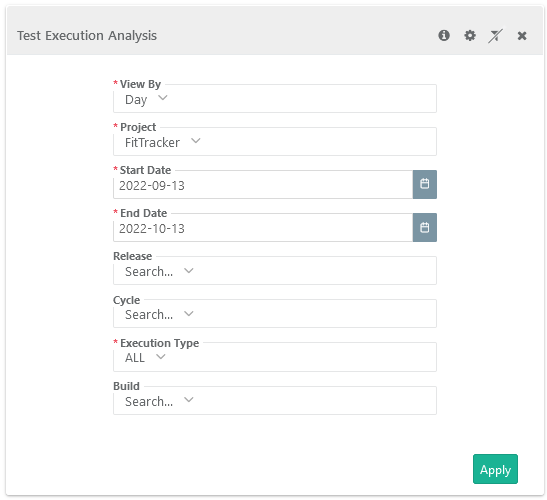
Filter Report:
Click on the Filter icon on the individual chart to generate the report as per requirement by applying multiple filters.
Start Date and End Date are based on Test Execution Run Creation Date.
This report shows the summary of issues raised during test case executions grouped by Workflow Status and Priority.
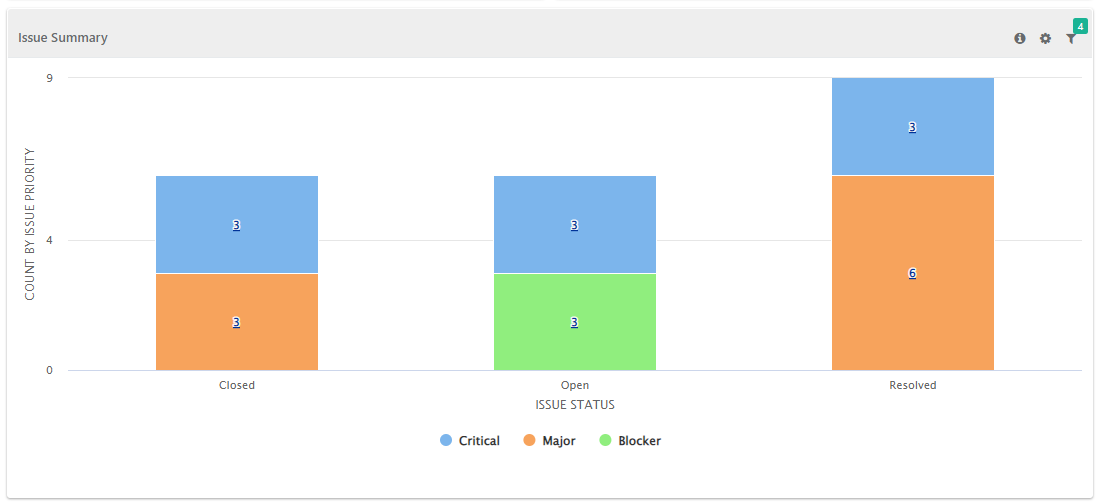
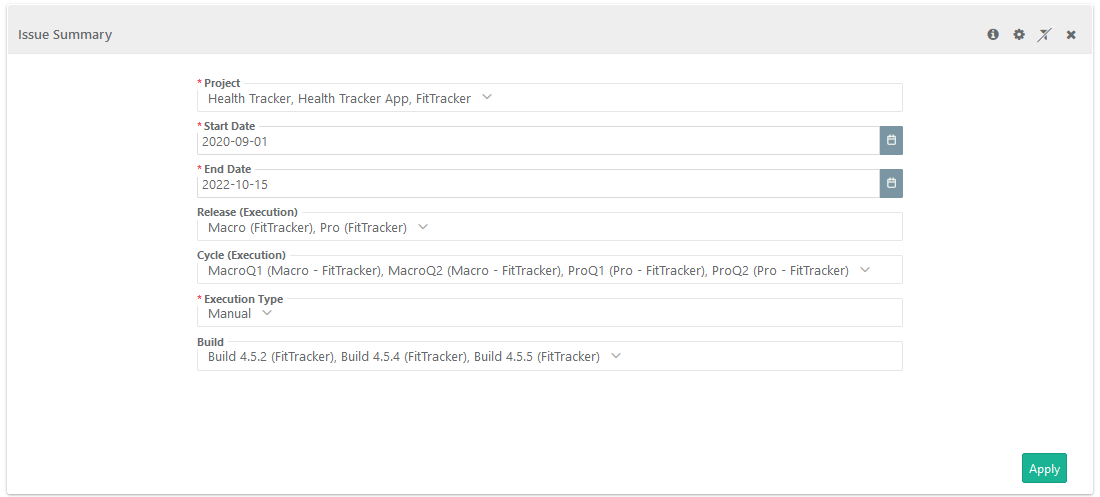
Filter Report:
Click on the Filter icon on the individual chart to generate the report as per requirement by applying multiple filters.
Start Date and End Date are based on Test Execution Run Creation Date.
This report shows the summary of test case executions grouped Assignee and Execution Status. This report graph can be filtered by assigned testers.
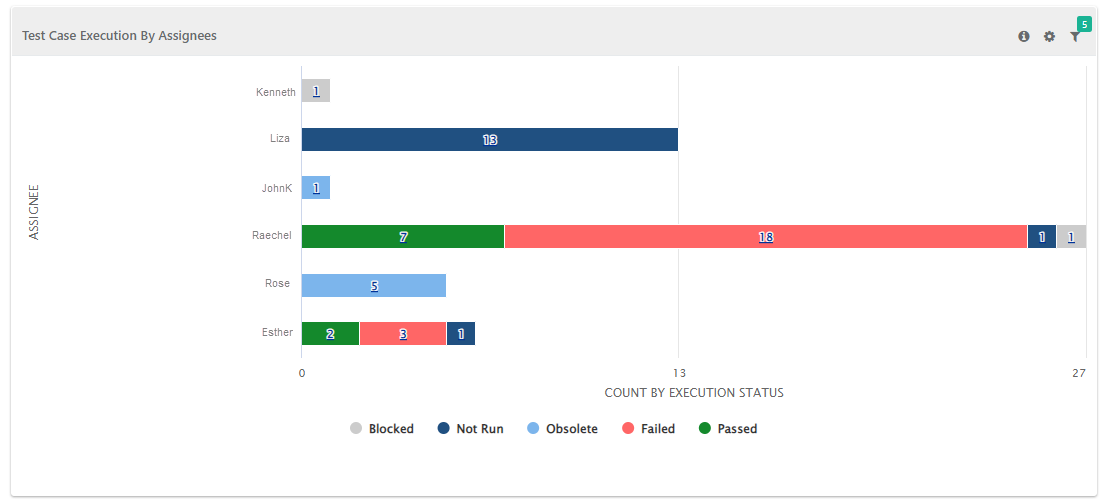
Filter Report:
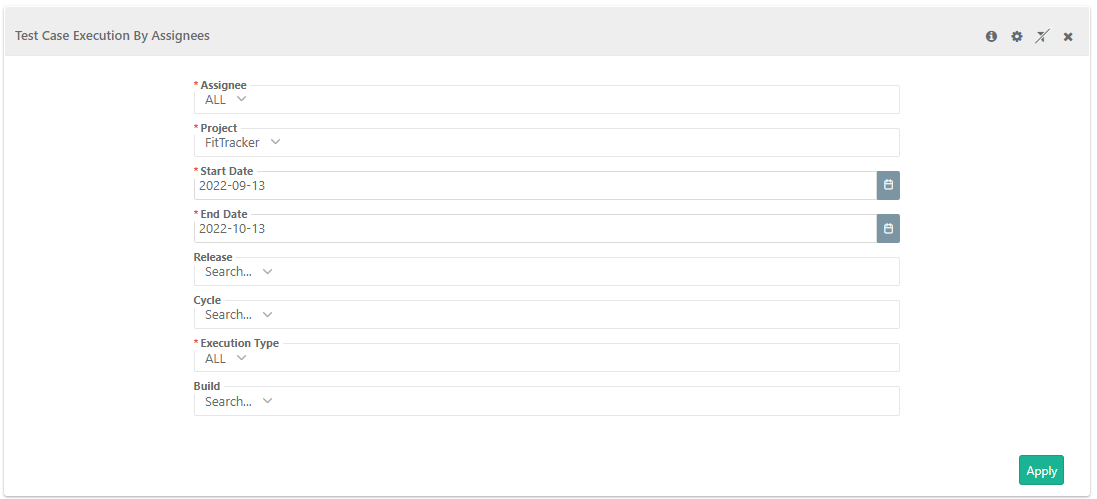
Click on the Filter icon on the individual chart to generate the report as per requirement by applying multiple filters.
Start Date and End Date are based on Test Execution Run Creation Date.
The Test Suites Execution Summary report displays the execution summary of test suites based on the execution status of its test case runs.
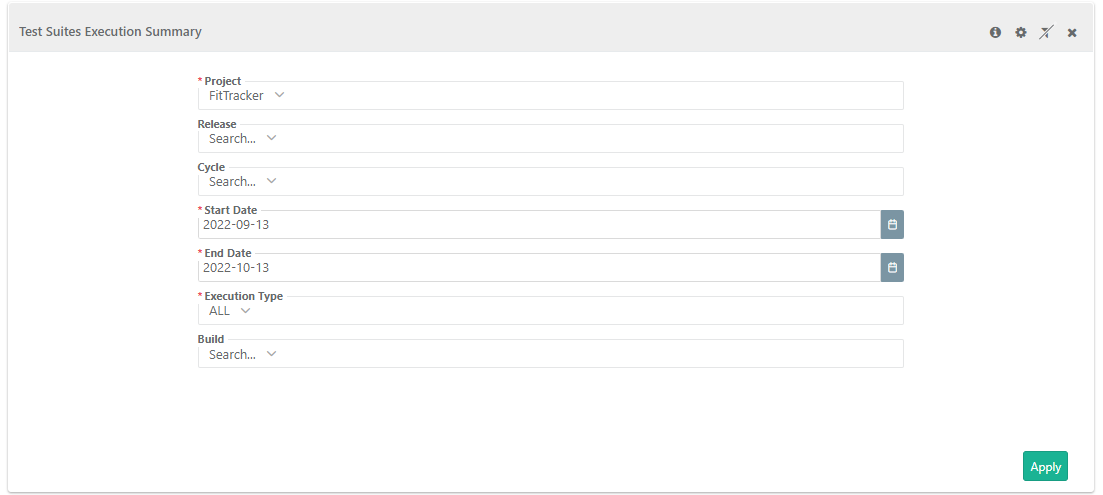
This report is generated by applying filters on Project, Release, Cycle, Start Date, End Date and Execution Type.
It includes Execution Summary of archived test case executions.
For eSignature enabled projects, the report shows count for Approved, In Review, Closed execution status.
This report displays overall test suite execution status so that users do not need to open each test suite to view overall execution status of it. This report is helpful for QA Leads and Managers as they can view execution status of test cases under individual test suites quickly without opening each test suite. For example, a test suite has 10 test cases within it - out of which 5 test cases are "Passed", 2 test cases are "Failed", and 3 test cases are "Not Run".
The Total Platforms and Total Test Cases columns in report displays the respective association with the test suite.
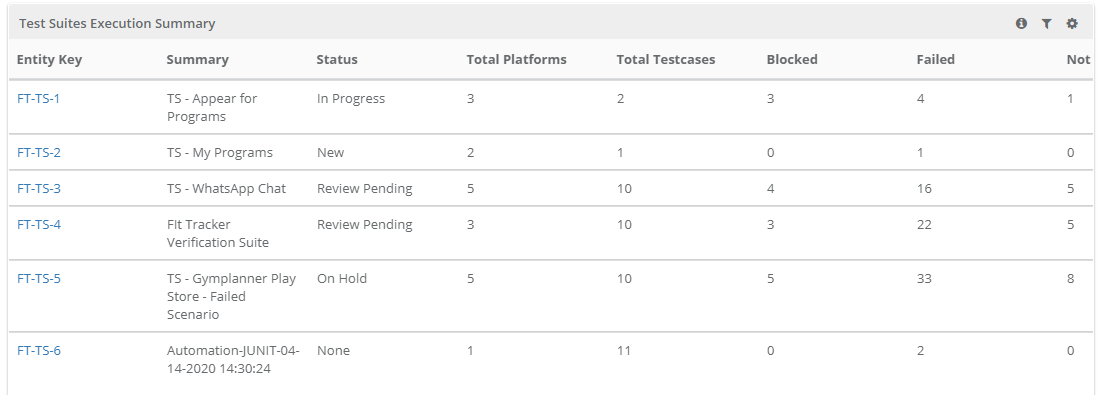
Filter Report:
Click on the Filter icon on the individual chart to generate the report as per requirement by applying multiple filters.
Users can set criteria for test suites to obtain the report. The following parameters are available to filter the report:
Project
Release
Cycle
Start Date: Start Date is based on Test Suite Creation Date.
End Date: End Date is based on Test Suite Creation Date.
Execution Type
Build
The report displays execution summary of the test case runs for a combination of Platform and test suites.
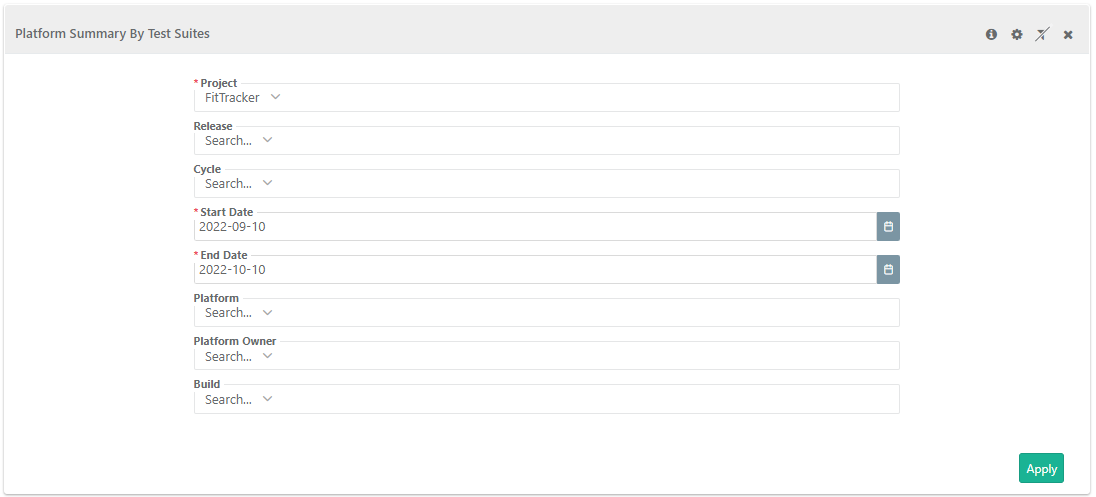
The report can be generated by applying filters Project, Release, Cycle, Start Date, End Date, Platform, and Platform Owner.
The report includes Execution Summary of archived test case executions.
For eSignature enabled projects, the report shows count for Approved, In Review, Closed execution status.
The report displays Platform Summary of all platforms including archived platforms.
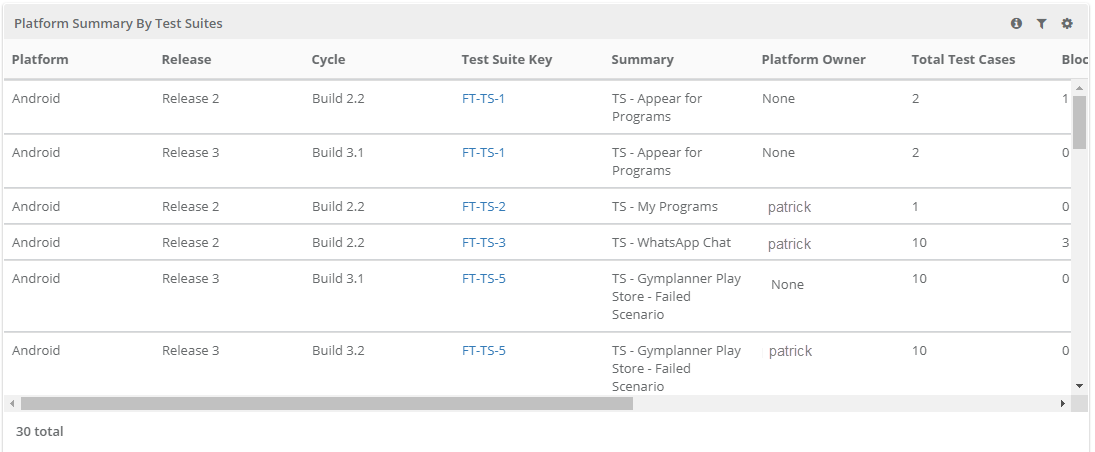
Filter Report:
Click on the Filter icon on the individual chart to generate the report as per requirement by applying multiple filters.
Users can set criteria for platforms to obtain the report. The following parameters are available to filter the report:
Project
Release
Cycle
Start Date: Start Date is based on Test Suite Creation Date.
End Date: End Date is based on Test Suite Creation Date.
Platform
Platform Owner
Build
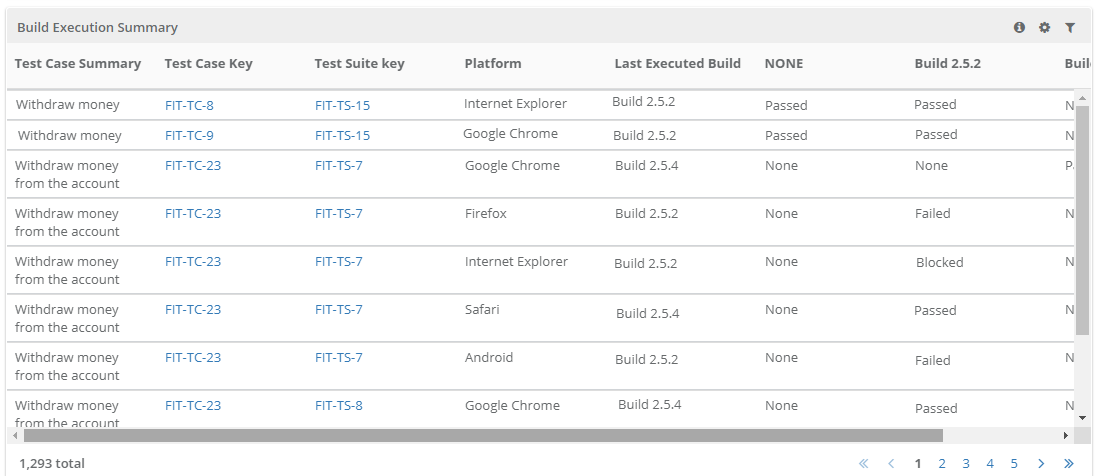
The Build Execution Summary report displays test case executions against Build, for combination of Test Suites and Platforms. It gives QA Manager a summary of which test cases are getting failed/passed against multiple builds. Looking at the summary, the QA Manager can take decision to exclude test cases which are passed against relevant platforms in different builds, in next execution run to save testing efforts.
The report column includes test case summary , test case entity key, test suite entity key, platform, Last Executed Build and selected build (all builds - if no build is selected).
NONE: If the test case is not executed under any build, then the execution status is shown under the None column.
Last Executed Build: Last Executed Build column shows the build name the test case was executed last.
Filter Report:
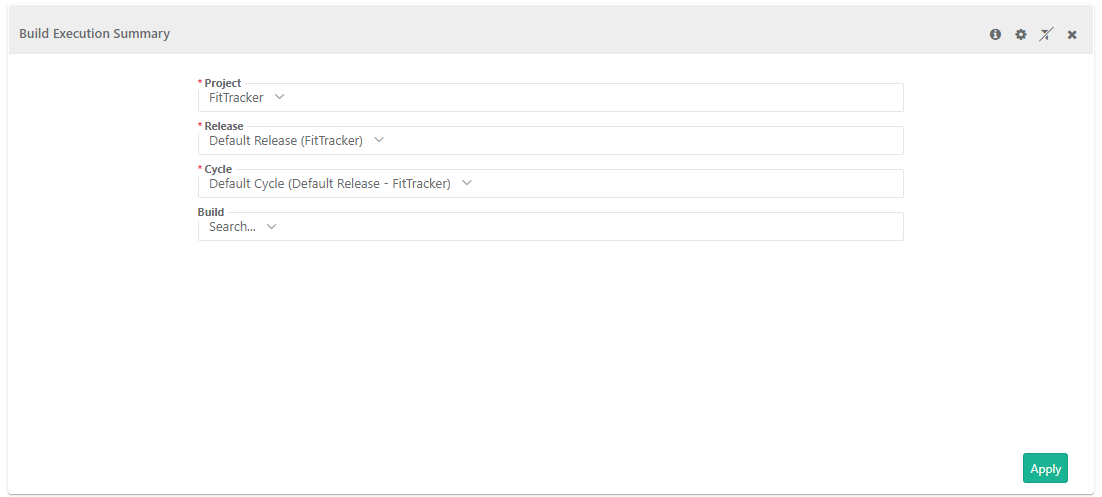
Click on the Filter icon on the individual chart to generate the report as per requirement by applying multiple filters.
Project (mandatory)
Release (mandatory)
Cycle (mandatory) Report will work on cycle level (Single cycle only), this will be mandatory filter.
Build: The selected build details will be displayed in the report if test cases are executed on that build. If a build is not selected, details of all the builds with execution will be displayed. Archived build will not be displayed.
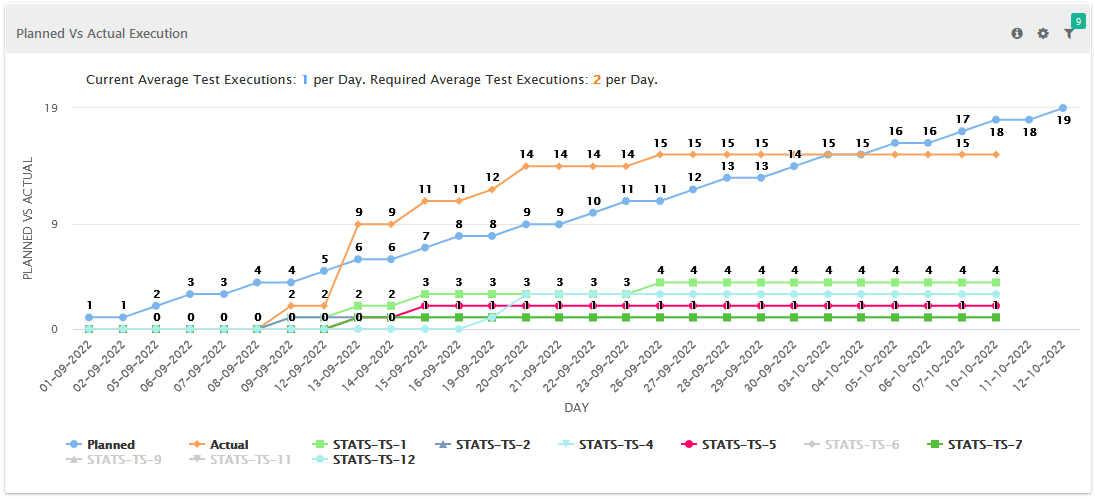
Planned vs Actual Execution analysis gadget under the Test Execution Summary report helps QA managers understand the current and expected execution rate to meet the release timelines. The report displays a Line Chart which that indicates the execution progress during particular sprint/period. It helps leads/managers review the current progress of test execution against the planned test execution and make decisions regarding resource allocation/task distribution to achieve the target.
The test run scope is defined through the selection of Project, Releases and Cycles. The list of test suites to be considered for planning is defined by applying necessary filters like Folders Path/Folder Name, Platform and Test Suite Key. This gives the total count of test execution runs planned for the selected scope.
The report can also be generated to have a granular view of the execution progress of individual assignees.
Planned Execution: Number of test executions planned during a particular sprint/period. It is calculated by applying the formula: Total Test Executions Planned/Number of Days. The chart shows cumulative count of the planned test executions.
Actual Execution: Number of test executions actually carried out during a particular sprint/period. The chart shows cumulative count of the actual test executions as per selected execution statuses.
For example,
A sprint is planned for 10 working days. There are 5 test suites with 50 test execution runs to be executed during the sprint.
Planned Executions will be calculated as 50/10 = 5 per day planned executions (i.e., 5 executions should be performed every day to complete the testing on time.) The chart will be plotted on the cumulative executions planned daily.
Actual Executions chart will be plotted based on the cumulative executions performed daily.
Current Average and Required Average Test Executions
Current Average of test executions is the actual average executions carried out in current time period.
Required Average of test executions is the rate at which the test executions should be performed to achieve the sprint target.
The following formulas are applied to get the values:
Current Average Test Executions = Total Actual / Completed Time Period
Required Average Test Executions = ( Total Planned - Total Actual ) / Remaining Time Period
Note: Required Average rate will be generated only if future date is applied in the filter.
If the Show Test Suite with Details option is selected in filter, the chart displays the actual progress of each test suite in the scope. The legend shows Test Suite Key and color. On hovering Test Suite Key, it shows Test Suite Summary. You can also disable test suite key to hide its data on the chart.
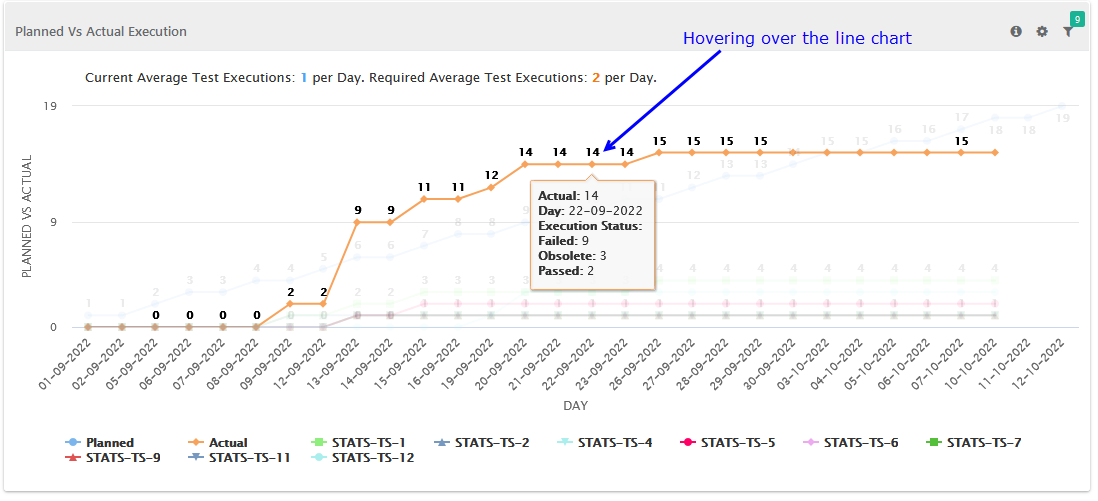
If you hover over an execution in the chart, it shows further details regarding that execution.
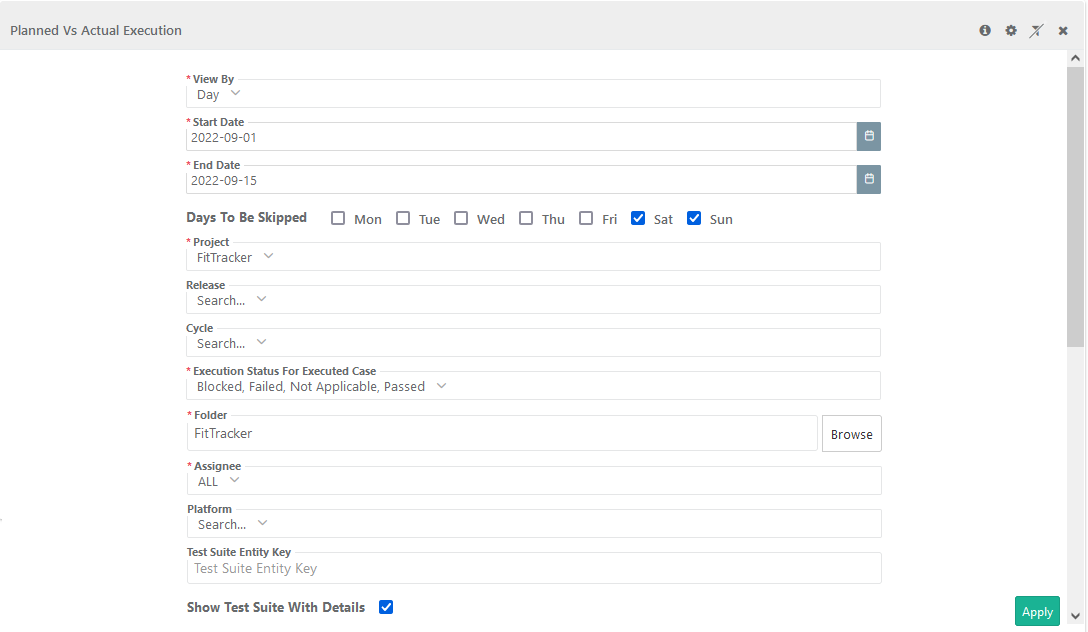
Filter Report:
Click on the Filter icon on the individual chart to generate the report as per requirement by applying multiple filters.
View By: Select from the options Day, Week and Month. For Daily report, you get an option to skip particular days from the calculation of duration. For example, 100 test execution runs to be completed in 10 days from 1st October to 15th October (excluding Saturday & Sunday).
Start Date and End Date: Start Date of Execution and End Date of Execution. The duration of sprint for which the Planned and Actual Test Execution Run will be calculated.
Project: Only one project can be selected.
Release: Release values populated in accordance with the project selection above.
Cycle: Cycle values populated in accordance with the release(s) selection above.
Execution Status for Executed Case: Select Execution Statues that should be considered as executed. For example, test executions with status “Passed”, “Failed” and “Not Applicable” are considered as executed. Rest of the execution statuses are not considered as executed. This filter is only applicable for actual executions.
Folder: Browse and select the test suite folder to consider the test suites under that folder for planning. If a parent folder is selected, then all the sub-folders under that parent will also be considered.
Assignee: Select a test suite assignee to have a granular view of execution progress of that individual assignee.
Platform: Select the platform(s) to consider test executions on that particular platforms for planning.
Test Suite Entity Key: Enter a single test suite key or comma separated test suite keys to consider those test suites for planning.
Show Test Suite with Details: Select the check box to view the actual progress for each test suite in the scope.
Export Report
To export the report, click on the cog icon for the report and select Export Raw Data.
The job scheduled message appears. You can check the export progress in the Scheduled Task section.