View Traceability for Story, Test cases, Executions, and Bugs.
Pre-requisites
Jira Project should be integrated with the QMetry project.
QMetry Configuration should be enabled in the Jira Project and its issue types like the story, bug, etc. integrated with QMetry
Uses should authenticate Jira from QMetry by following the below steps.
Go to QMetry > Integrations > Jira Integrations.
Go to Integrations tab > Click on Options cog icon > Configure. Enter the Jira Credentials.
The QMetry Test Case panel in Jira shows Test case and test steps details along with Test Execution.
Go to the Jira Story that is synced with QMetry Requirements linked to Test Cases.
Select the QMetry Project. QMetry Project: It shows QMetry Projects with which the Jira story is synced. If the story is synced in more than one QMetry project, the drop-down will show more than one QMetry Project. Once you select the project, QMetry Key populates for the Story synced in QMetry as a requirement.
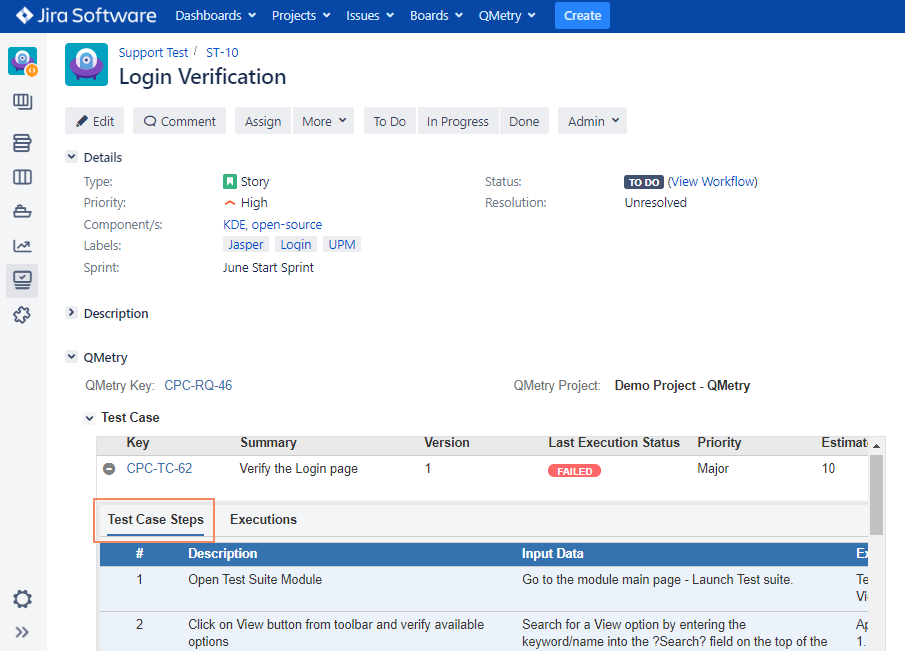
Under Story, the Test Cases section displays all the Test cases linked to the Requirement. The test case & steps details are shown with respect to the version linked with Requirement. The Test Case row shows details like Test Case Key, Summary, Linked Version, Last Execution Status, Priority, Estimated Time, Status, Testing Type. The latest execution status shown the test case details is irrespective of the version linked to the Requirement - it’s the latest (based on the timestamp) executed status of the test case. Jira users can quickly view the information they need from the Jira Story detail page itself. For example, Developers want to see the current execution status of the test case and bugs linked.
Expand the test case row to view Test Case Steps and Executions details of the test case.
On expanding the test case, two tabs are displayed:
Test Case Steps: The Test Case Steps tab displays the test case steps of the version linked with Requirement. Clicking on Test case Key will open the Test Case Details screen in Jira.
Executions: The Executions tab displays Test case executions for a combination of test suite, release, cycle, platform, and executed version, for all versions that test case.
Details like Test Suite Key, Test Suite Summary, E.V. (Executed Version), Platform, Release, Cycle, Status, linked Bug icon (click on the icon to view the details), Attachments icon (click on the icon to view the details), Comments icon and Executed by (including Date & Time) are shown here.
Test Suite Key has a link on it, clicking on which opens the Test Suite page in QMetry.
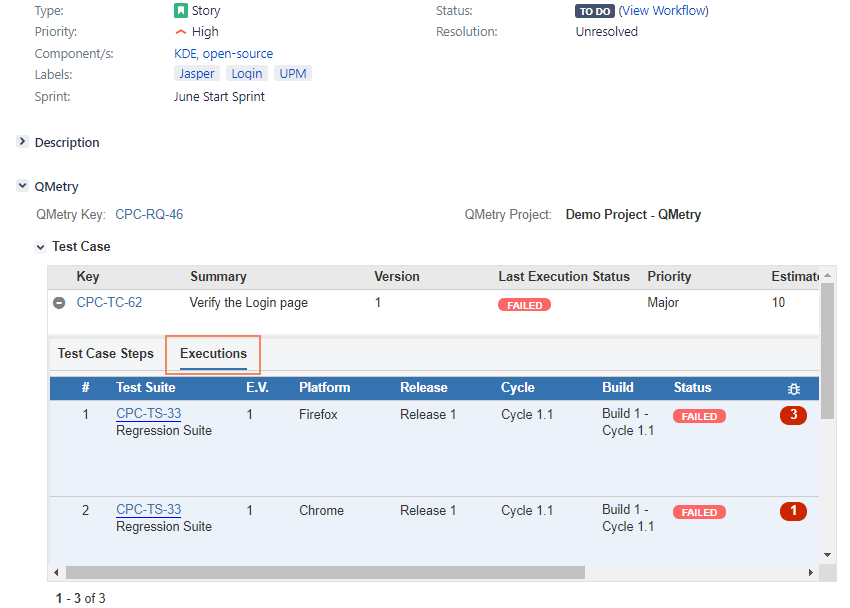
If a bug is linked to the test case, the count is displayed in the Bug column. The bug details are available by clicking on the count, which opens up Issues pop-up. Clicking on the Issue Key opens the issue detail page in Jira.
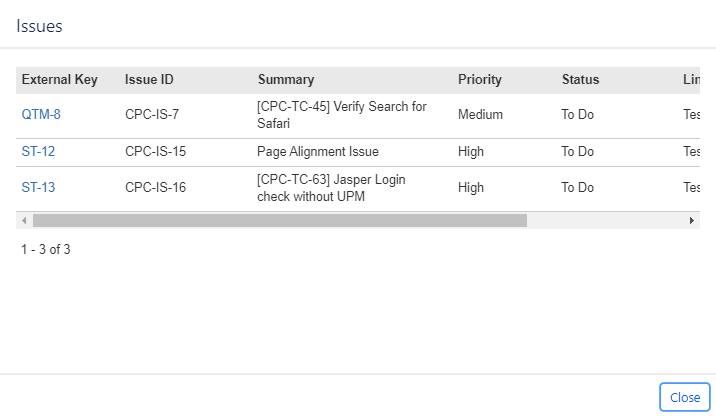
If Jira story is linked with a test case in QMetry, the test case link in requirement will open a remote issue page for Test Case View. Refer to Test Case View in Jira Add-on below on this page.
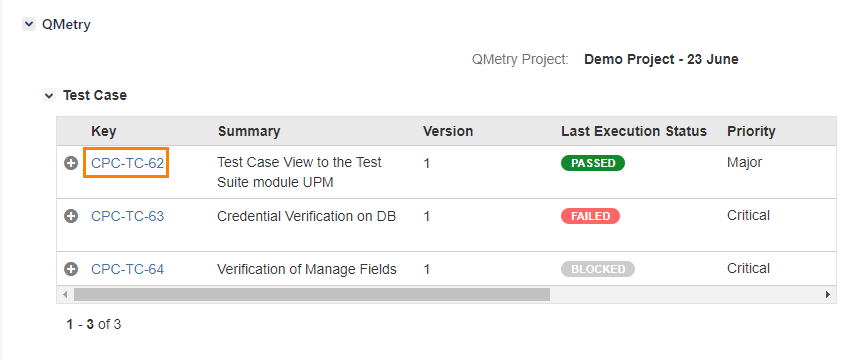
Clicking on the Test Case Key will open the Test Case View in Jira Add-on which shows all the test case and execution details.
A test case is created and linked with a test suite in QMetry. Release & Cycles and Platforms are associated with the test suite for test execution. On the execution screen, the Jira issue is linked with a test case as an external issue. The issue link opens in Jira.
Clicking on Test case Key in Test case section will open the Test Case View in Jira.
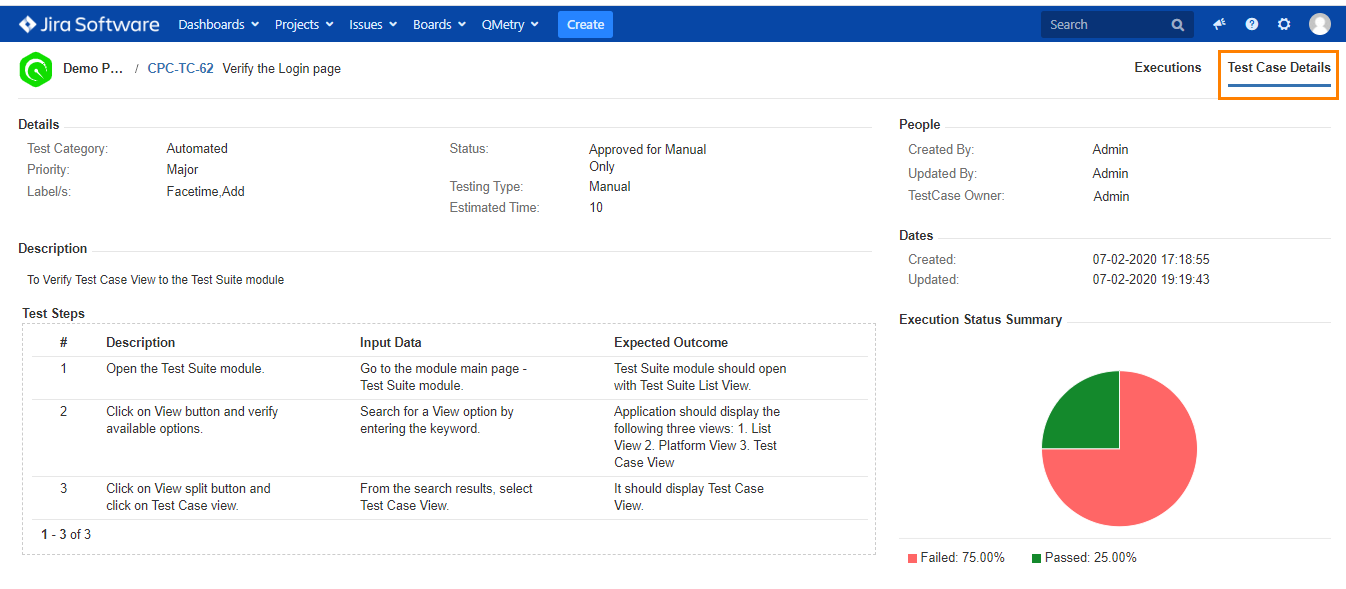
Test case detail page in Jira displays Execution & Test case details in separate tabs.
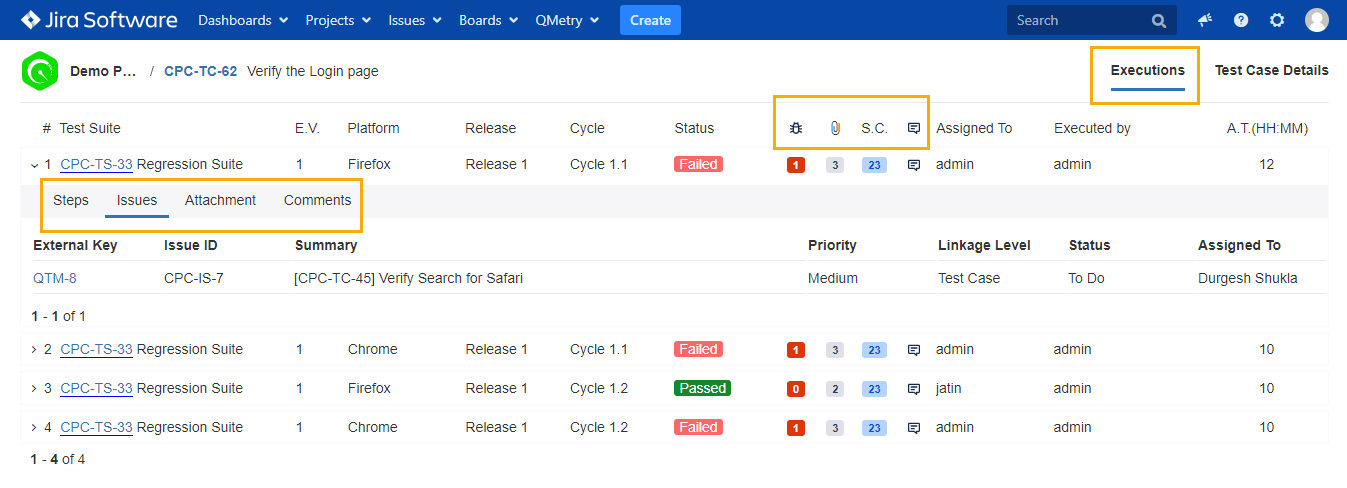
Execution tab displays
Test case executions for a combination of the test suite, release, cycle, platform, and executed version.
Test case step execution details.
Linked Bugs, Test logs, Comments for the test executions, and test step.
Test case details display complete test case information.
Test Case Details
The Test Case Details tab displays details entered for the test case in QMetry and its Execution Status Summary.
Executions
The Executions tab displays test suites in which the test case was executed. The test suite link opens in QMetry. You can view Bugs, Attachments, S.C. (Step Count), and Comments for the test case. The counts can be clicked to expand the test suite row to show its relevant tab in the expanded area. Other columns include Executed by and A.T. (Actual Attendant Time).
Each test suite row is expandable. The expanded area has four tabs on it: Steps, Issues, Attachment, and Comments.

The bugs linked directly to requirements in QMetry will now appear in Jira Story “Issue Links” section.
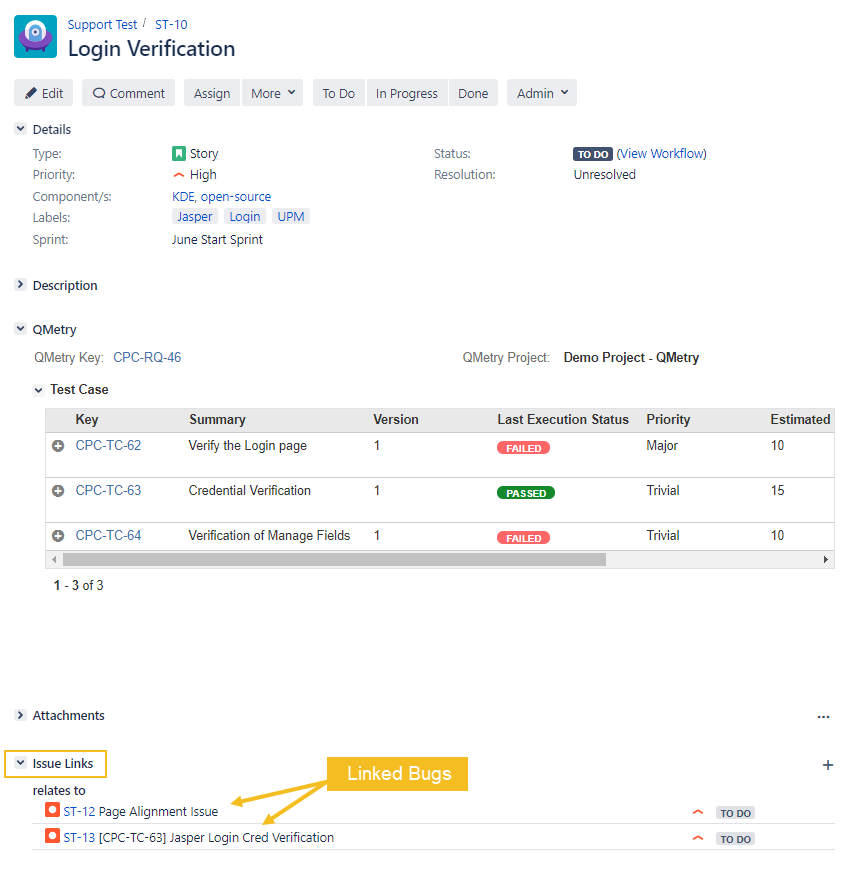
When a test case is marked as failed during the execution, and a bug is raised on the Test Suite Execution screen, that bug gets raised in Jira and its external key (Jira issue key) is shown in QMetry. On clicking on the External Key of the issue in QMetry, it opens bug details in Jira. The Test Cases section on the Jira issue details page also displays the Linkage Level of the issue - Test Case/Test Step along with other details of the test case.
Expand the test case row to view Test Case Steps and Executions details of the test case.
On expanding the test case, two tabs are displayed:
Test Case Steps: The Test Case Steps tab displays the test case step details.
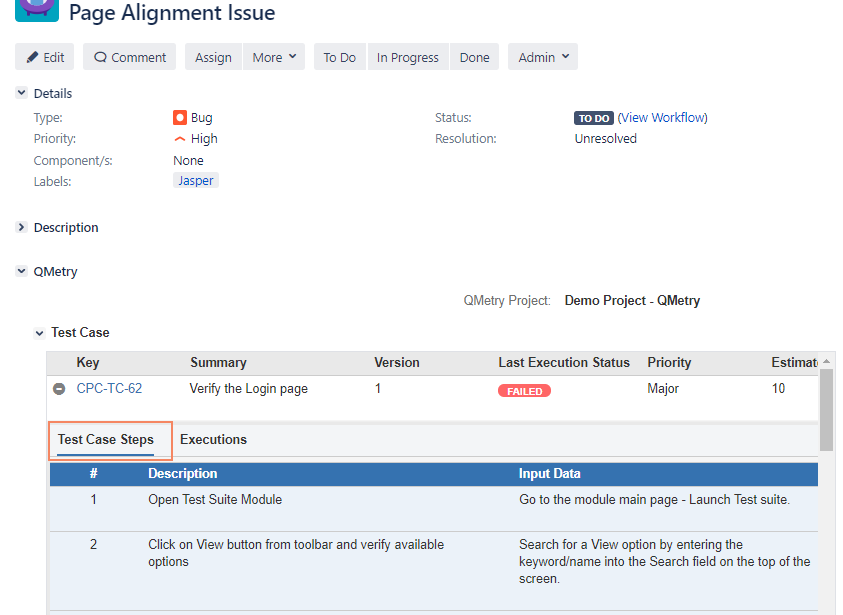
Executions: The Executions tab displays details like Test Suite Key, Test Suite Summary, Executed Version, Platform, Release, Cycle, Status, linked Bug (click on the icon to view the details), Attachments (click on the icon to view the details), Comments and Executed by. Test Suite Key has a link on it, clicking on which opens the Test Suite page in QMetry.
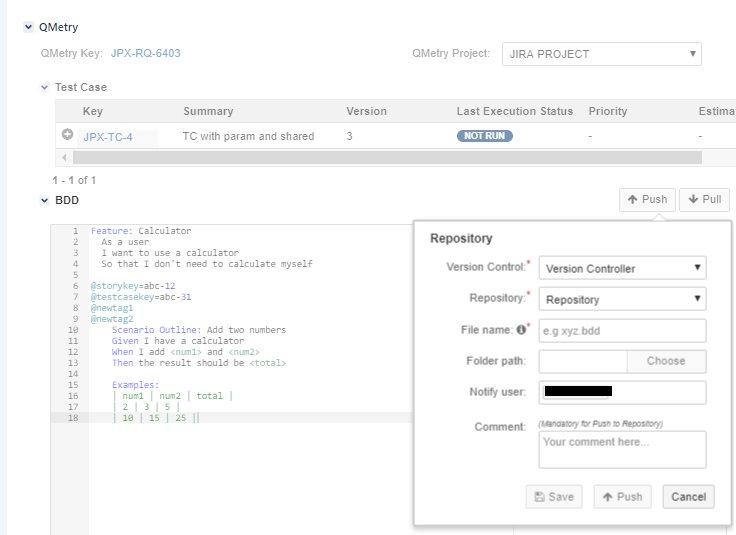
When a version control system is configured for the QMetry project, the BDD panel will be visible in the stories imported as requirements. The BDD panel in QMetry will appear read-only for the requirement imported from Jira; however, any changes made in the BDD panel in Jira will reflect in the BDD panel in QMetry.
Scenario: If one Jira project is configured with more than one QMetry Project and Jira stories are synced in QMetry. Here, one Jira story is synced in more than one QMetry project.
QMetry Project: It displays QMetry Projects with which the Jira story is synced and the version control system is configured. In this case, the drop-down will show more than on QMetry Project.
For the selected project, provide BDD Configuration details to pull the BDD details.
Version Control list will populate according to QMetry Project selection.
The repository list will populate according to selected Version Control.
Whatever changes you make in BDD and push, it will impact only selected QMetry Project.
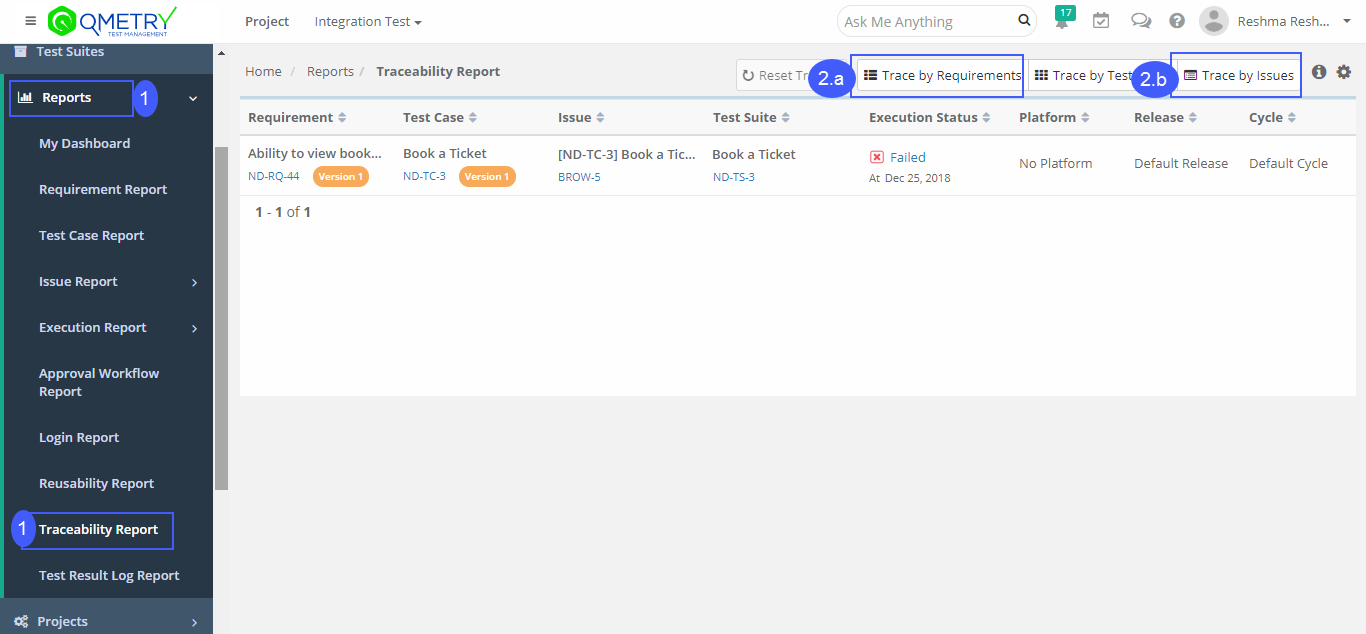
Go to Reports > Open Traceability report.
Select Trace by :
For Requirement Traceability: Select Trace by Requirement
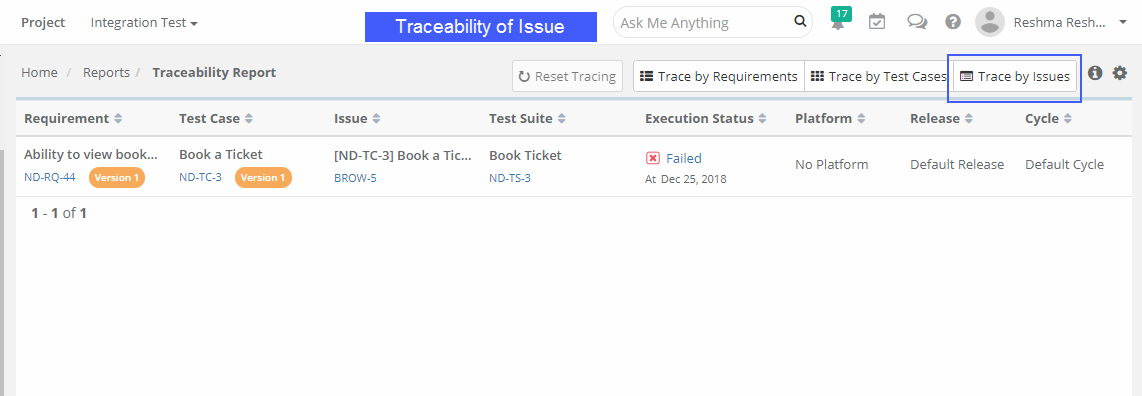
For Issue Traceability: Select Trace by Issue
Select entity > Apply
