How to add Customized reports to Dashboards and Galleries (3) (3)
Adding Your Customized reports to Dashboards and Galleries
The Visual Analysis includes an optional feature that lets you create a visualization in the Thinkspace and then add it as a new panel in an existing Logi Dashboard in another report, or add it to a Visual Gallery.
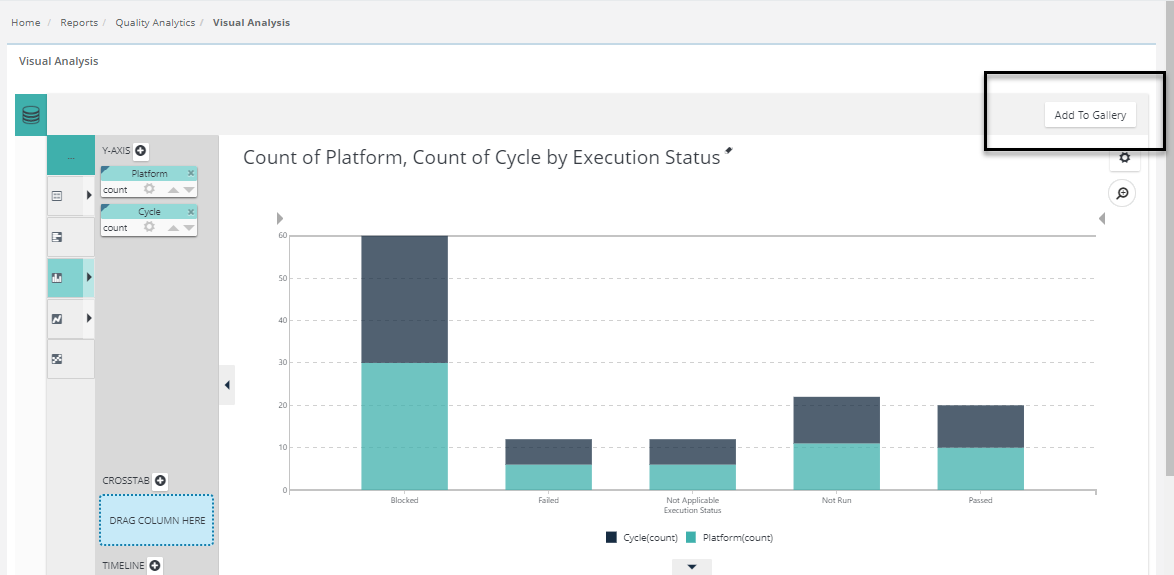
It will say to : "Add to Gallery" >> Add panel.
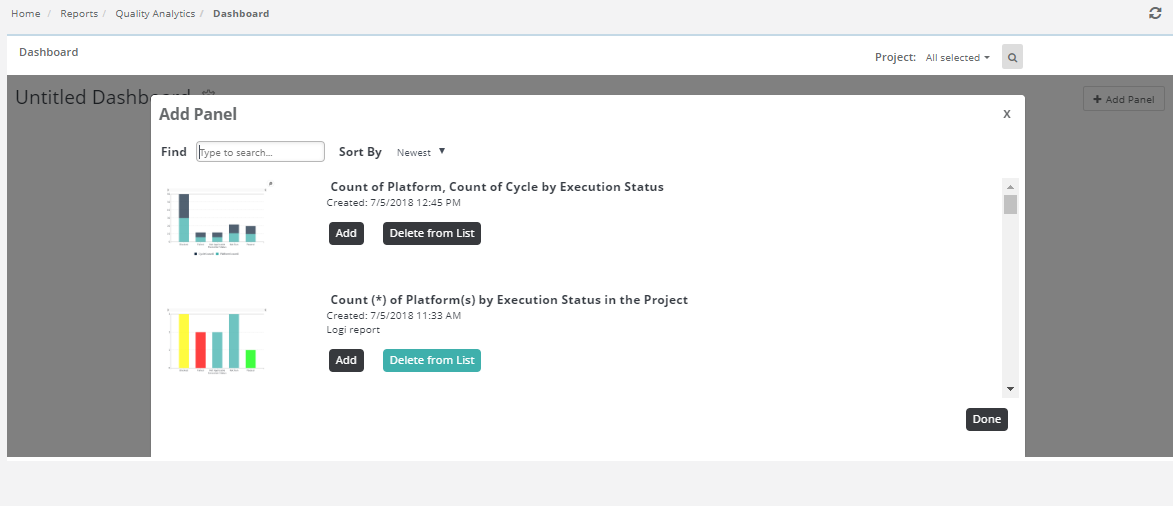
It will go to : Add panel >> (Quality Analytics > Dashboard).
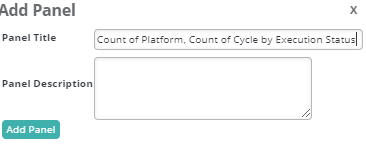
When configured for use with a Dashboard and the button is clicked, the visualization is added immediately as a new panel in the Dashboard, as shown above. Just before the visualization is saved, you'll be prompted for the Panel Title (with the chart title from the Thinkspace provided as a suggestion) and an optional description for display.
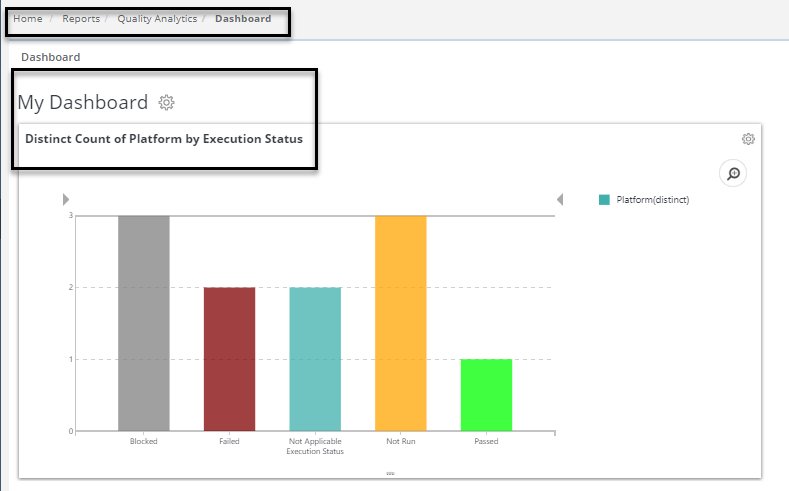
The new visualization thereafter appears in the Dashboard Configuration Page or the Visual Gallery, as shown above, just like any other resource, complete with a thumbnail image. The visualization can be removed from the visible dashboard panels and from the configuration page or gallery entirely, using the usual controls.
You can insert multiple charts into a Dashboard using this technique. For more information about Dashboards.