How to Create & Organize Dashboard in Visual Analysis? (4) (4)
Create Dashboard
To create Dashboard in a folder, first select the folder on the tree.
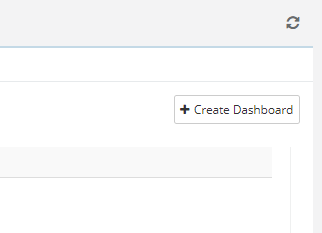
Click on the Create Dashboard button at top right corner.
The Add Panel pop-up opens.
The panel has default graphs that can be added as dashboard.

Click on the Add button for the graph to add it as dashboard. You can add as many graphs as you want from the available ones.
Finally click on Done.
The charts are added on the dashboard.

A. Project: You can select multiple projects to generate the reports for.
B. Rename: The dashboard can be renamed. Click on the con icon beside the dashboard name and click on Rename.
C. Add Panel: You can keep adding graphs on the dashboard using the panel.
Organize Dashboard
You can create folders and organize dashboards within corresponding folders. Dashboards can be moved from one folder to another folder using drag and drop.
