How to view Issue Summary Report? (4) (4)
Issue Summary
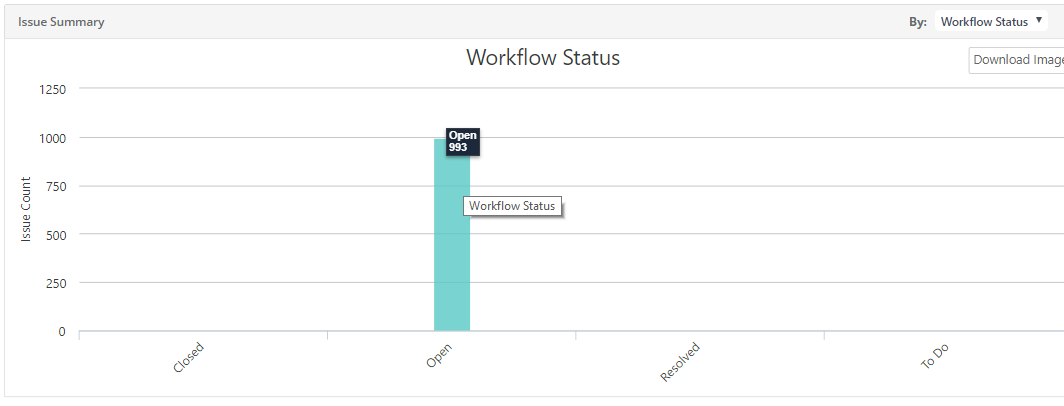
Issue View by Workflow Status: The report shows issues by their workflow status i.e. the value in the Statusfield of issues.
Issue View by Priority: The bar chart report shows all Issues organized by priority.
Issue View by Type: The pie chart shows issues categorized by type.This is the Type mentioned while creating an issue/logging a bug.
Issue View by Assignee: The report shows all issues organized by their assignee.
Issue Count by Status & Priority
As the name suggests, the report gives count of issues bu Status and Priority assigned to them. The legends are provided below the graph.
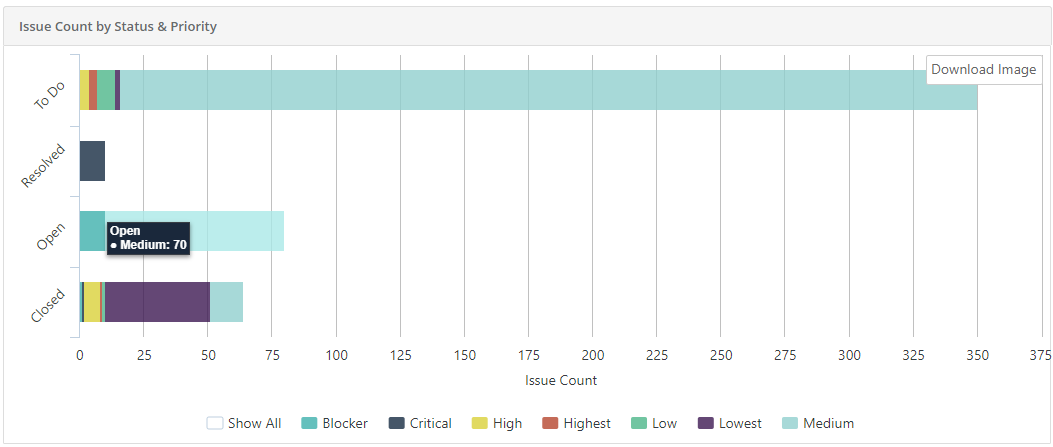
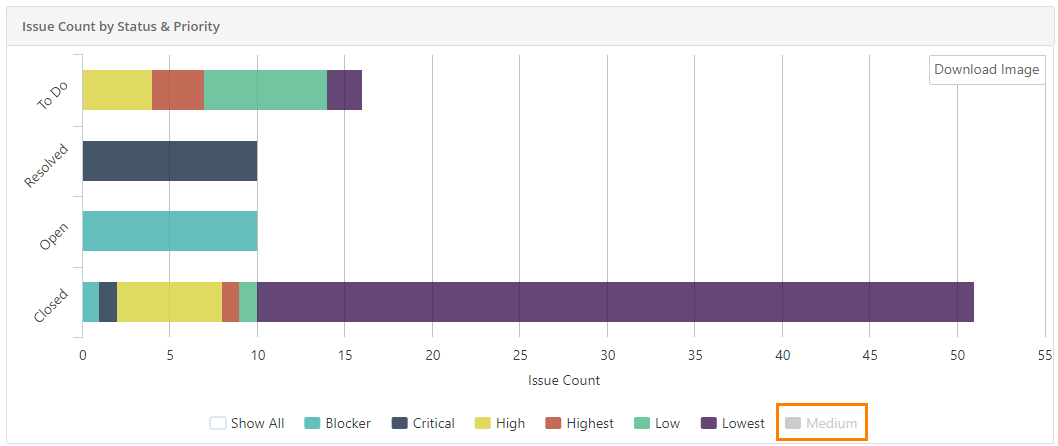
The legends are clickable. You can hide/show Priority displayed on the graph by clicking on the corresponding priority.
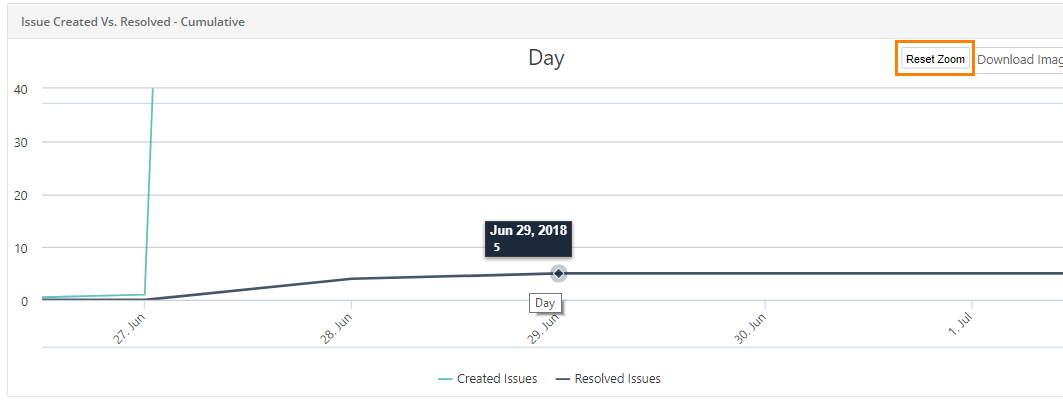
Issue Created Vs. Resolved - Cumulative
The report displays a line chart that helps QA Manager visualize the trend in issue logging and issue resolving by testers over a period of time. It compares issues creation vs. issue resolved during the same period. Mere issue creation does not fulfill QA task, issues which are fixed by development team need to be resolved in the same pace to achieve equilibrium in the testing process.
The ideal graph should look like a burn down chart that indicates a narrow gap between the count of issue creation and issue resolution.
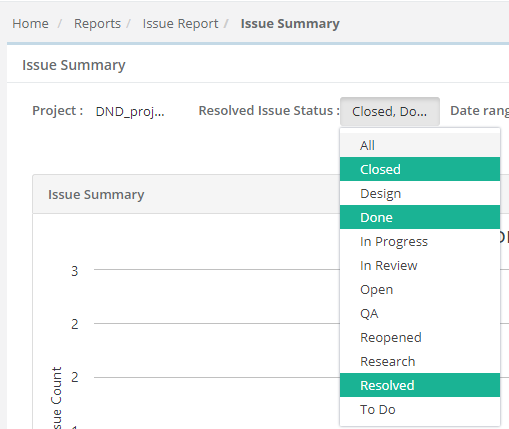
Resolved Issue Status: Select the status that denotes issues as "Resolved". Multiple statuses can be selected to define the criteria for "Resolved" issues. Issues with those statuses will be considered as "Resolved" for the report. By default, the "Resolved" Status is selected.
To view the count for Created Issues and Resolved issues, hover the mouse over corresponding lines.

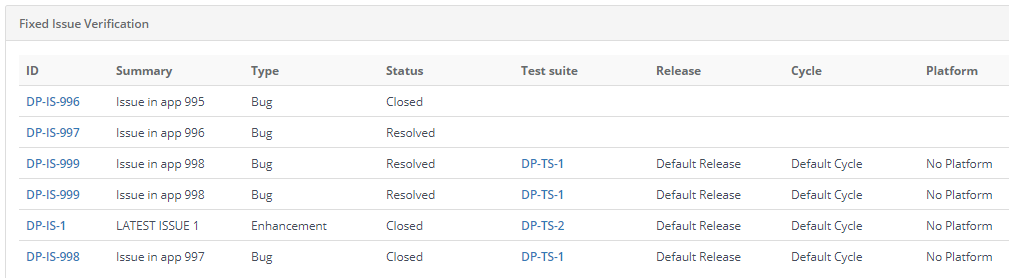
Fixed Issue Verification
The tabular report displays traceability of issues which are marked as "Resolved". Issues are displayed with their associated test suites and test cases.
The report is generated on the basis of the status you selected as "Resolved Issue Status" at the top of the report.
Resolved Issue Status: Select the status that denotes issues as "Resolved". Multiple statuses can be selected to define the criteria for "Resolved" issues. Issues with those statuses will be considered as "Resolved" for the report. By default, the "Resolved" Status is selected.
The report also displays details of test suites and test cases associated to resolved issues.
Zoom in the Chart
You can zoom-in the chart view for a particular period by just holding and dragging the mouse pointer to select a particular area on the chart. It enlarges that covered area on the chart and let you view more granular details. It gives you a closer look of the period you selected on the chart above.
To go back to the original view, click on the Reset Zoom button on the chart.
Download Chart
You can see the Download Image button on hovering over the individual charts. The download functionality makes it easier for users to save charts as images with PNG format.
Click on the Download Image button and the download process starts.