How Requirement Report can be viewed? (4) (4)
Requirement report provides standard industry matrices used by Product Manager/Owners, Business Analysts, QA managers, Scrum Masters/Owners to get a summarized view on coverage and execution status for selected scope i.e combination of Project, Release and Cycle. The summary graphs can drill further to get the details of requirements. The fields/columns can be grouped, sorted, selected (show/hide), resized. Graphical report can be exported in Pdf or Png formats and drilled down details can be exported in Excel or Csv format. The report can be generated for multiple projects.
Requirement reports shows the following matrices :
- Requirement Coverage: The report shows summary of requirements by their coverage status based on test case linkages. Requirement is covered if it is linked to one or more testcases

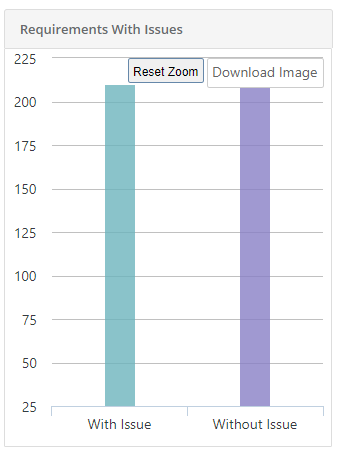
- Requirement With Issues : The report shows the summary of requirements linked to issues. This report will count issues that are linked to requirements linked.

- Planned Requirements: The report shows summary of requirements Planned or Unplanned for execution. A requirement would be considered as planned once all the test cases linked to it are added to a Test suite.

- Requirement Summary by Workflow Status/Priority : The report shows summary of requirements grouped by their workflow status / priority.

Download Chart
You can see the Download Image button on hovering over the individual charts. The download functionality makes it easier for users to save charts as images with PNG format.
Click on the Download Image button and the download process starts.
Zoom in the Bar Chart
You can zoom-in the chart view by just holding and dragging the mouse pointer to select a particular area on the chart. It enlarges that covered area on the chart and let you view more granular details. It gives you a closer look of the portion you selected on the chart.
To go back to the original view, click on the Reset Zoom button on the chart.