How to apply custom colors to VA report? (4) (4)
As reports are customizable in QMetry Test Management, you can make changes to the reports as often as you like. Addition to this. we can also apply the custom colors to the VA report as per the column pills (i.e. based on Field(s) & its values) by specifying certain condition to the visualization.
Consider the example, we want to prepare a custom report (i.e. Bar chart) for 'Count of Test Cases by Execution Status'; where we want to set the colors as per the Execution Status of the Test cases.
Here’s how you do it,
- Select your Entity (i.e. Execution) & Project.ccc
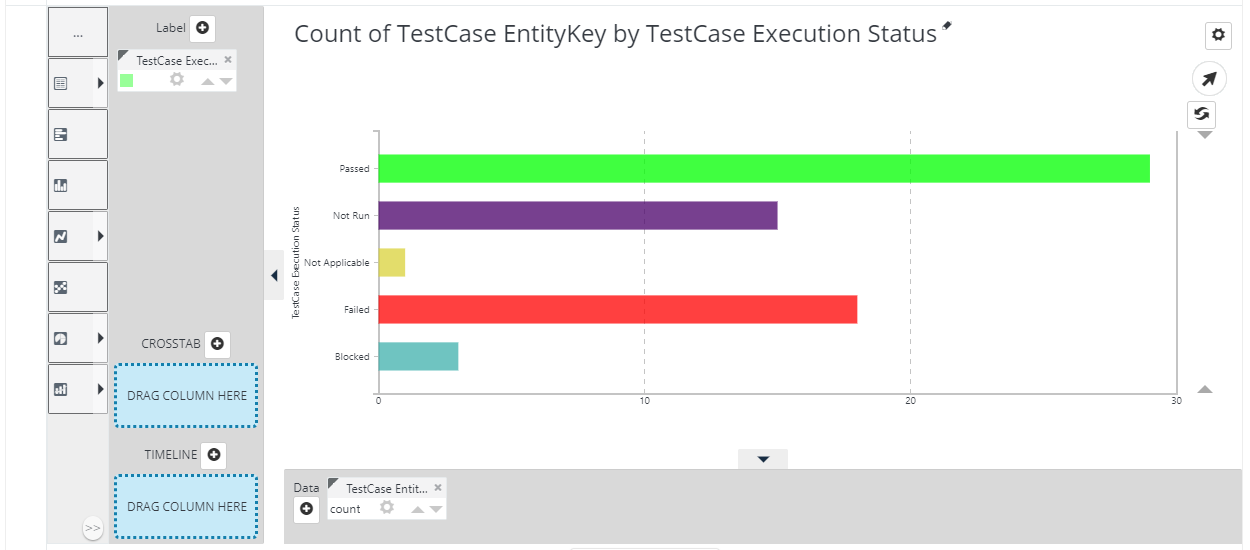
- After the Visuals loads, select the Bars chart from the visualizations menu on the left of the page.
- Specify the columns by drag & drop to the X & Y-axis.
- A Columns would be, TestCase EntityKey & TestCase Execution Status.
- Drag the TestCase EntityKey column pill to the X-axis & TestCase Execution Status column pill to the Y-axis.
- You can see the bars chart is generated with the default theme (i.e. with no colors).

- In order to apply the custom color based on the test case executions, click on the Gear icon of the TestCase Execution Status column pill, turn on the flag for Colors section by specifying the condition(s). i.e. select the condition as Equals from the dropdown & specify the value (i.e. Passed) along with selecting the color(s) - Green. You can click on the color box to get multiple colors options. Finally, click on Apply to save the changes.
Note: Value section is case sensitive, make sure you're specifying the exact value to get the color impact on the graph.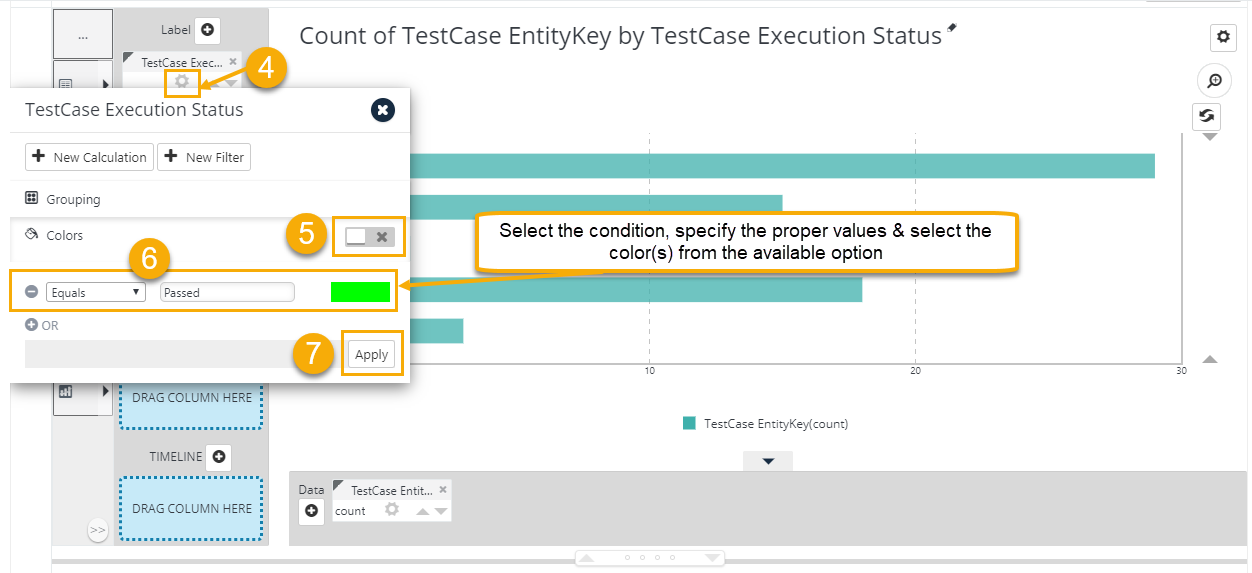
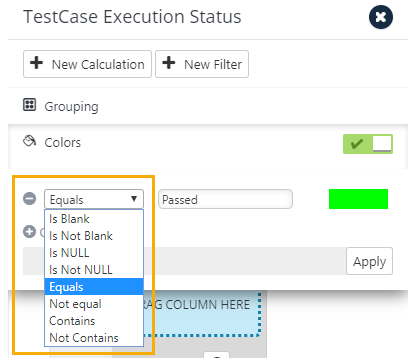
- You can also select multiple conditions from the available options & set the colors accordingly.

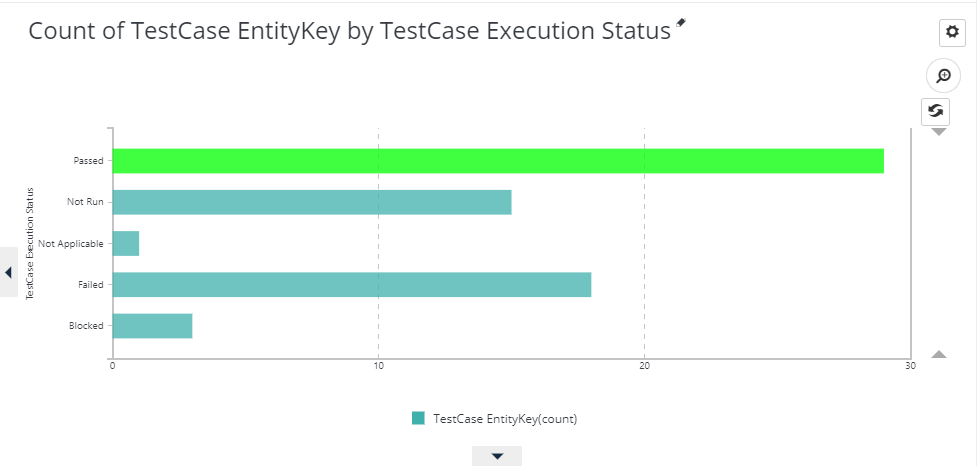
The above steps help you to understand how custom colors can be set by specifying the condition & the relevant value of the column you've used.