How to explore the charts created under visual analysis report? (4) (4)
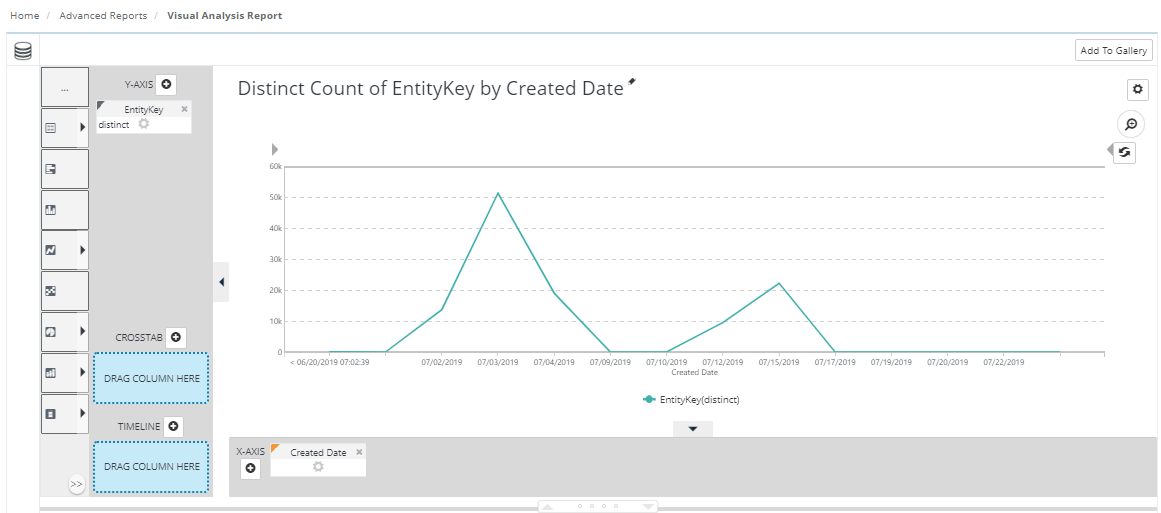
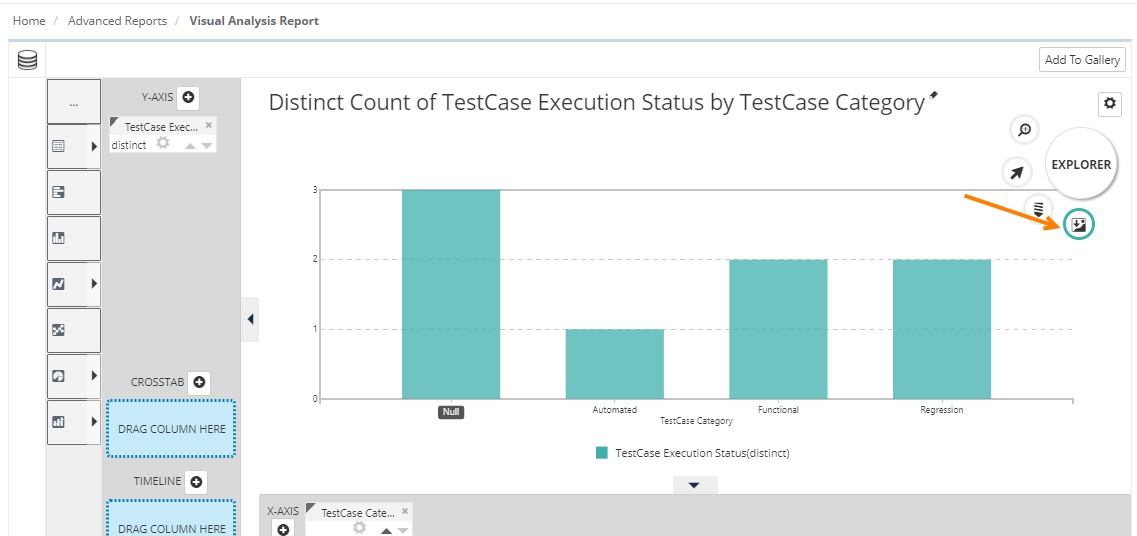
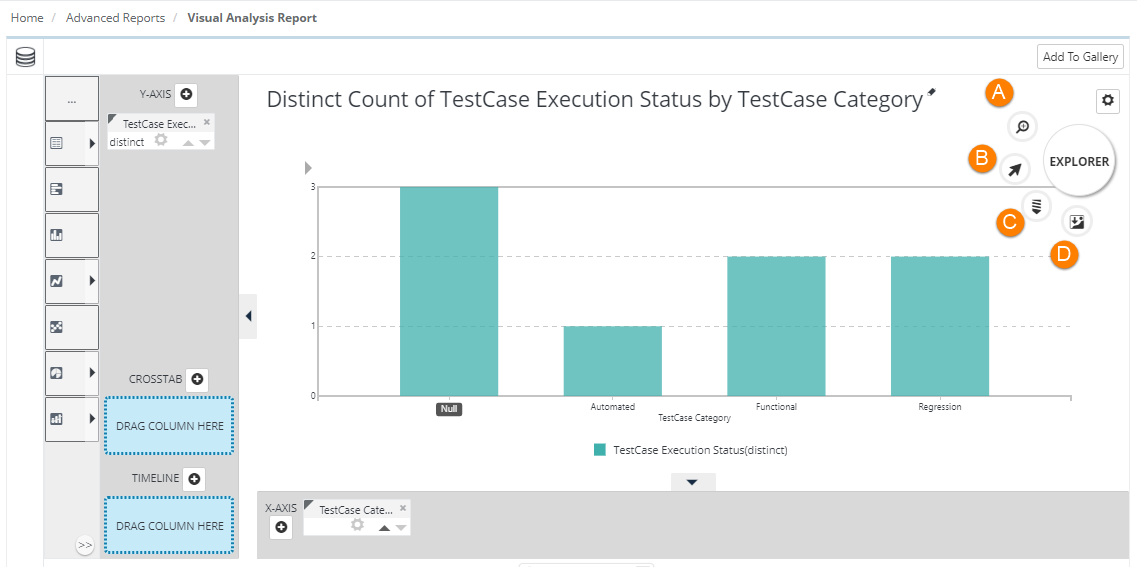
User can explore the chart using the icons provided with the chart. In order to understand the usage of each icon, we have created a custom report by selecting the visualization option as Column. Here, we have created a VA report for 'Distinct count of TestCase Execution Staus by TestCase Category', and we will be exploring this chart using the icons available with the chart.
| Icon | Description |
|---|---|
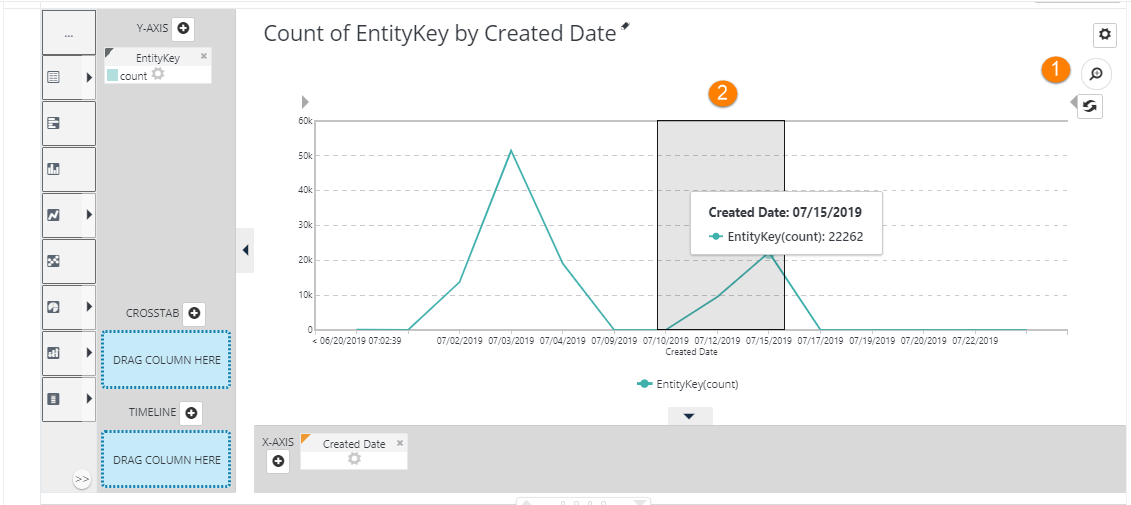
 | The icon is used to zoom in and zoom out on the chart. For example, there is a line chart displaying test case creation count during a specific period. You can zoom in to particular days to view the test case creation count only during those days. Click on the zoom icon and select the area on the chart that you want to focus on. You can select the area through drag and drop.
You can get a closer look at the area now. You can still adjust the view of the chart by dragging the bar ends above the chart.
|
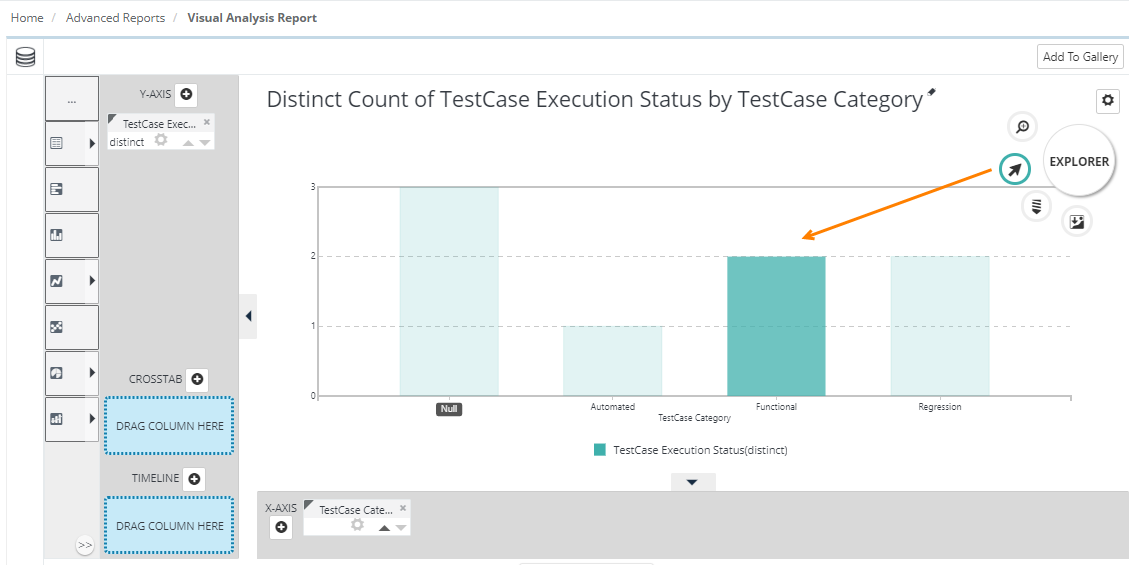
 | This icon is used to focus on a particular section of the chart. Select the icon and click on a specific bar/column to highlight it. To take out the highlight click on the bar/column again.
|
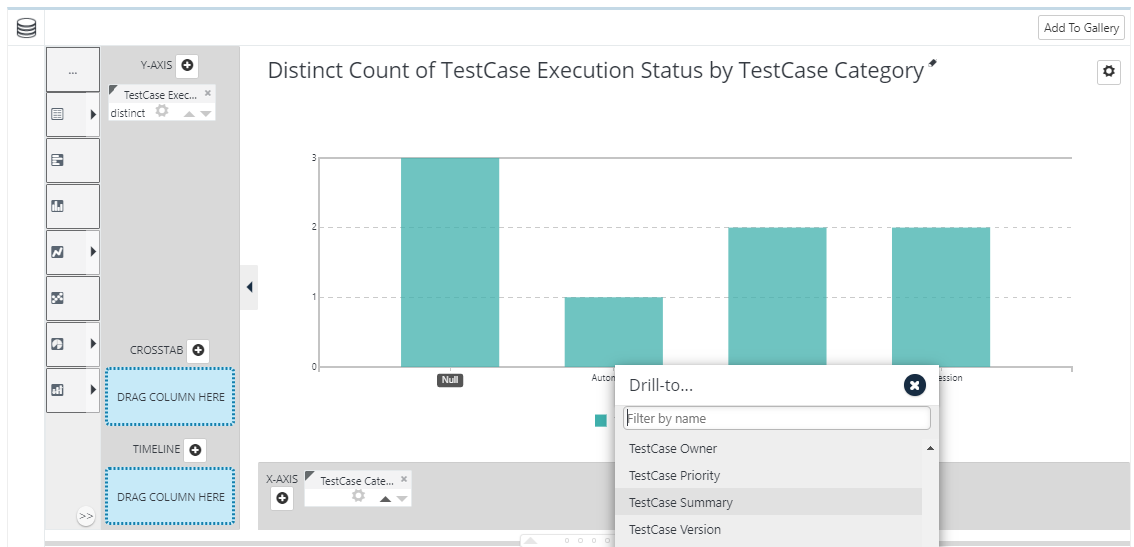
 | This icon is used to drill down on a specific bar/column. For example, we drill down on the Functional column by selecting the icon and clicking on the Functional column.
It asks you to select the field to which you want to drill down further and view the details of. We are selecting Test Case Summary here to view.
As you drill down, the chart displays the conditions applied to its outer side.
You can further drill down to other information by clicking on the bar/column of Test Case Summary. The conditions applied to the outer side will keep adding above the chart. To reverse drill down or to get back to the previous chart, just click on the recent condition displayed on the chart. To get back to the original chart, just click on the very first condition displayed on the chart. |
 | The icon is used to download chart in PNG format. You can attach the chart in your email communication or share with other users as required. Click on the icon and it will download the open chart in .png format.
The chart is downloaded as shown here.
|