Back to QMetry All Products Help Page
Issue Trends
Issue Created Vs. Resolved - Cumulative report will show only QMetry issues. It will not display data for QMetry Projects that are synced with Jira Project.
Introduction
Issue Trends reports can be generated for multiple projects. You can view the details pertaining across project.
- Project: Select project to generate the report for. Users can select more than one project on the list.
- Release: Select release(s) on the list.
- Date Range: Provide Start Date and End Date either directly typing in the field or using the calendar.
- Select Issue Priority and Issue Type.
- Click on the Search button.
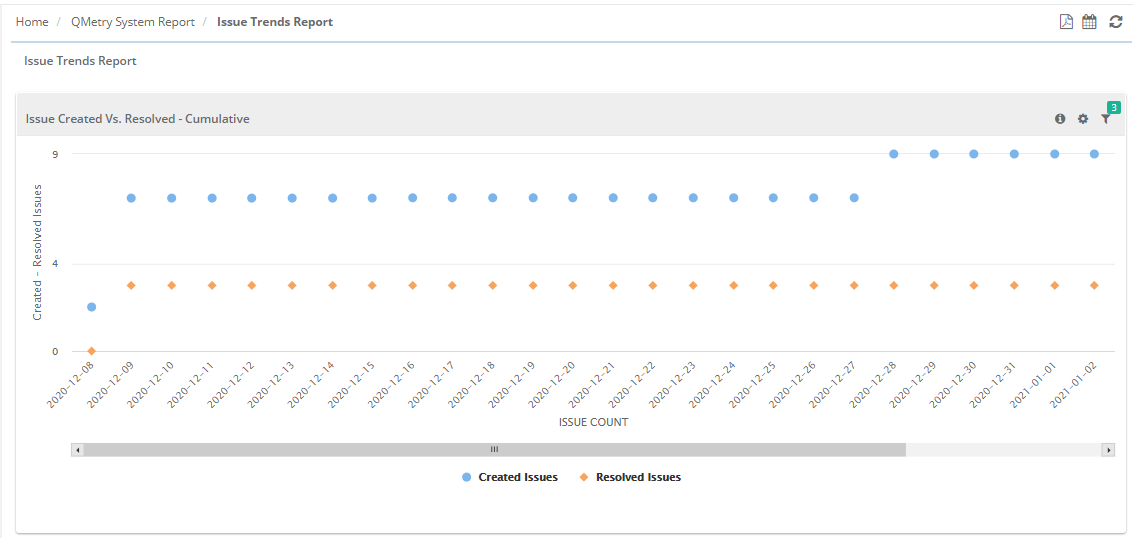
Issue Created Vs. Resolved - Cumulative
The report displays a line chart that helps QA Manager visualize the trend in issue logging and issue resolving by testers over a period of time. It compares issues creation vs. issue resolved during the same period. Mere issue creation does not fulfill QA task, issues which are fixed by development team need to be resolved in the same pace to achieve equilibrium in the testing process.
The ideal graph should look like a burn down chart that indicates a narrow gap between the count of issue creation and issue resolution.
Configuration related to Resolved status is provided at project level to define issue status in which issue will be considered as "Resolved".
Configure Resolved status for issue from Projects > Project/Release/Cycle.
When multiple projects with different Resolved status configurations are selected to generate the report, it displays issue records for respective projects accordingly. The report is generated on the basis of the status you selected as "Default Resolved Status".
To view the count for Created Issues and Resolved issues, hover the mouse over corresponding lines.
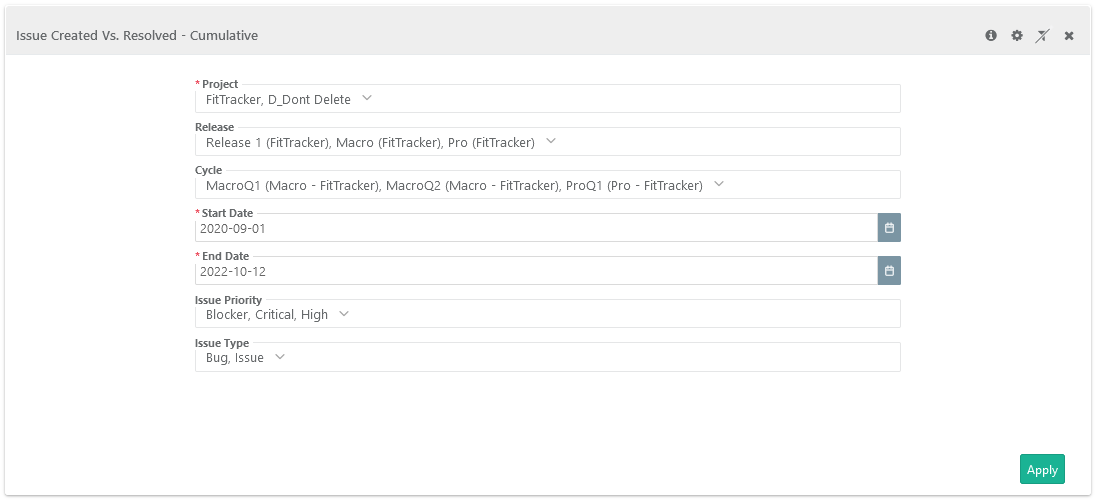
Filter Report:
Click on the Filter icon  on the individual chart to generate the report as per requirement by applying multiple filters.
Note: “Releases” are associated with the Internal module issues and are not associated to the Jira issues. Hence, skip selecting the Release filter in case of Jira issues.
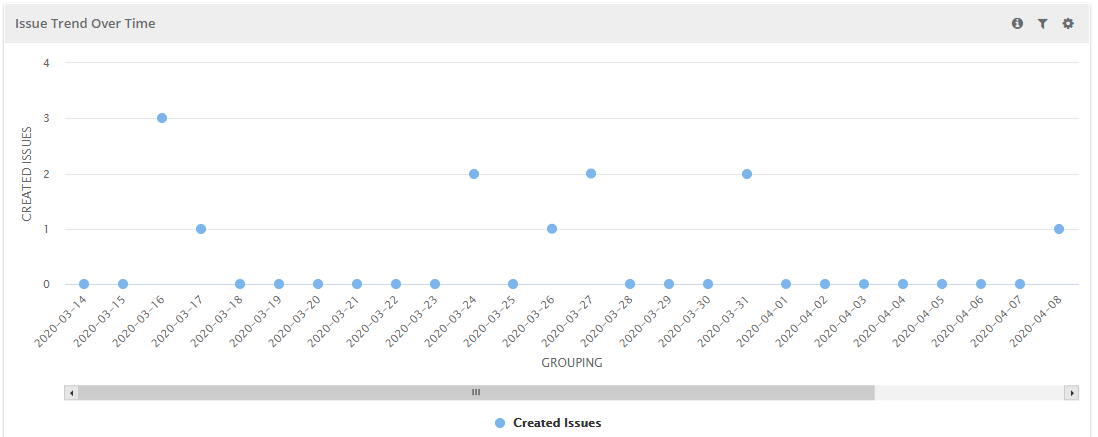
Issue Trend Over Time
This report shows line graph displaying the count of Issues created (on Y-axis) and Creation Date (on X-axis).
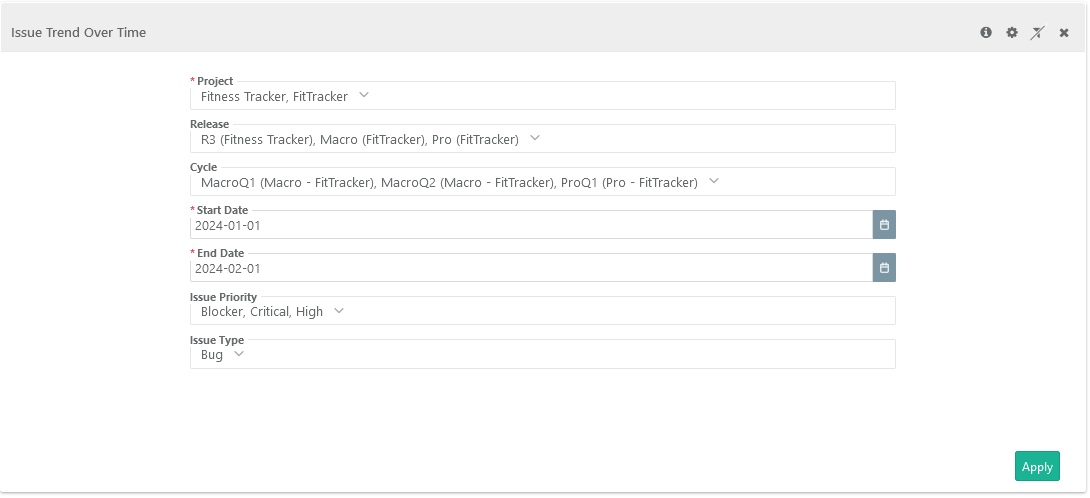
Filter Report:
Click on the Filter icon on the individual chart to generate the report as per requirement by applying multiple filters.
Note: “Releases” are associated with the Internal module issues and are not associated with the Jira issues. Hence, skip selecting the Release filter in case of Jira issues.
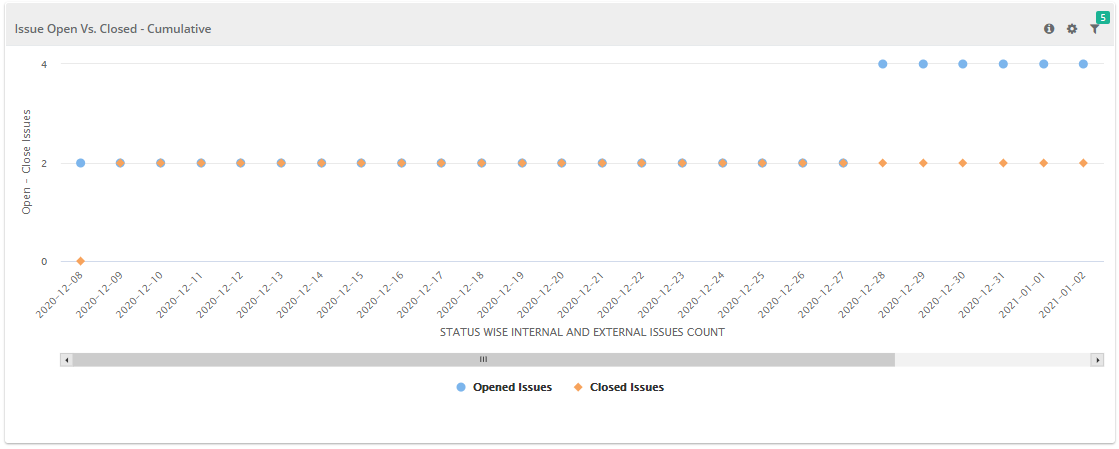
Issue Open Vs. Closed - Cumulative
This report shows line graph displaying count of issues in "Open" State and issues in "Closed" State. The count is cumulative e.g., on 11th May the "Open" Issue count is 3. On 12th May more 4 Issues are added with "Open" State, then the cumulative count of Issue will be 7.
Users can select Open Status and Close Status. In case of Status change of issue, the report also considers the Status change date and current Status of issue.
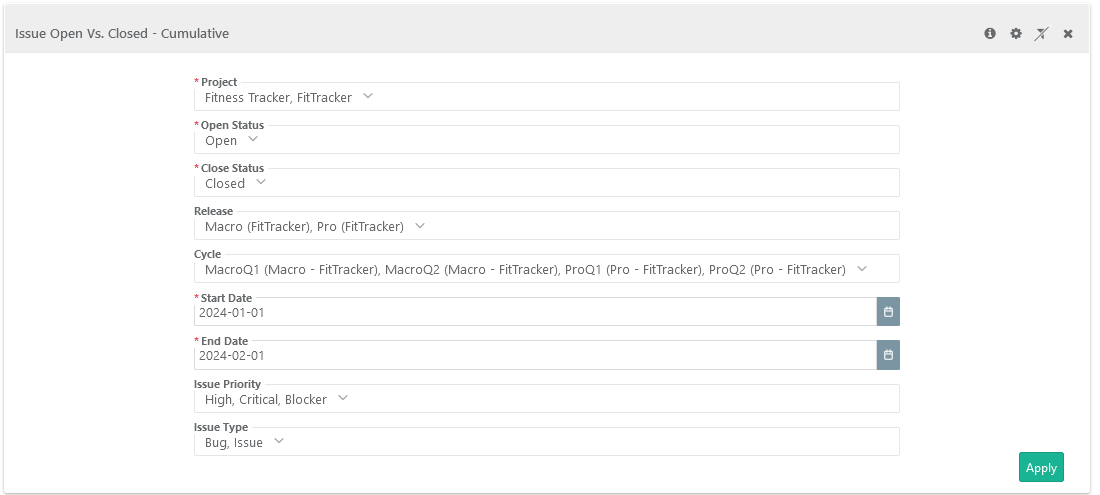
Filter Report:
Click on the Filter icon on the individual chart to generate the report as per requirement by applying multiple filters.
Note: “Releases” are associated with the Internal module issues and not with the Jira issues. Hence, skip selecting the Release filter in case of Jira issues.
Back to QMetry All Products Help Page