Back to QMetry All Products Help Page
How to see Login Report?
The login report (available under QMetry System Report > Login Summary Dashboard) shows the login/logout summary for the selected users. Admins use this report for audit purpose on user logins & to find out any unauthorized access from unknown IP’s.
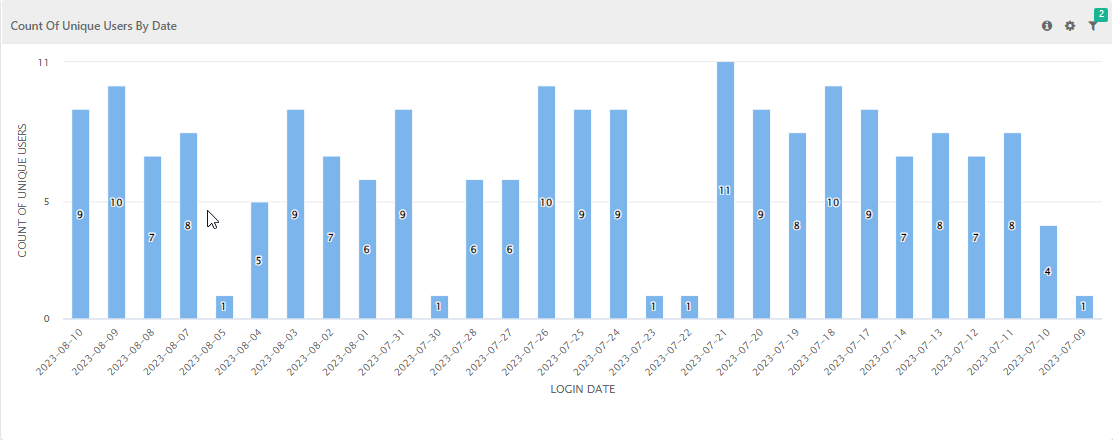
Count of Unique Users By Date
The report displays count of unique users who logged in on any date for the chosen date range. By default, the report shows details for the last one month.
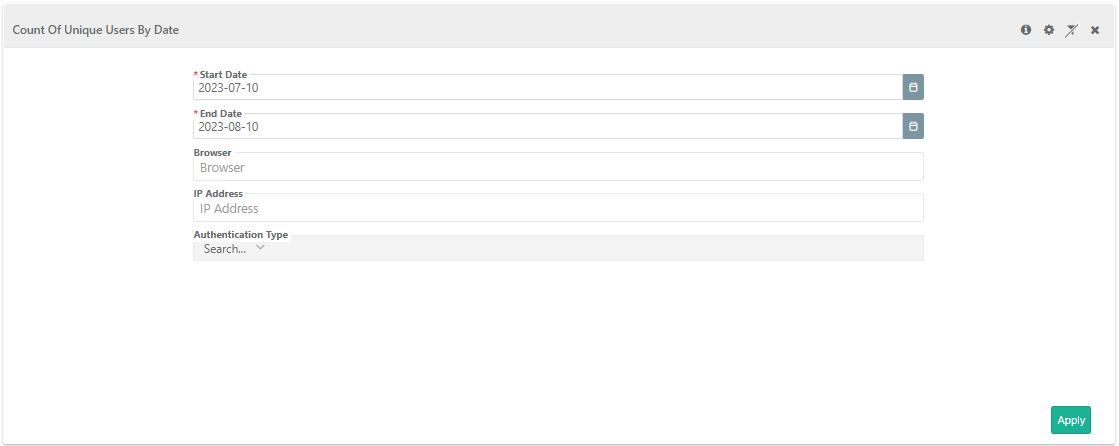
Filters
Start Date - Default 30 days before
End Date - Default current date
Browser
IP Address
Authentication Type - QMetry, LDAP, SAML
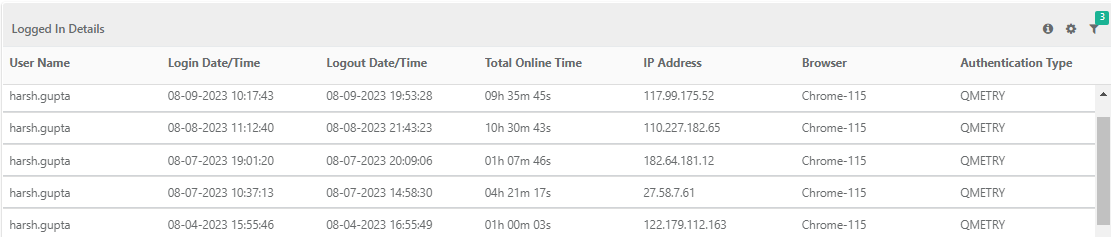
Logged-in Details
The above graphical chart is displayed in a tabular format. This section of the report displays the login details of the selected user.
Online Login User
The section displays all users who are logged into QMetry and are online at present. The details can be searched for a particular user(s) using the drop-down menu.
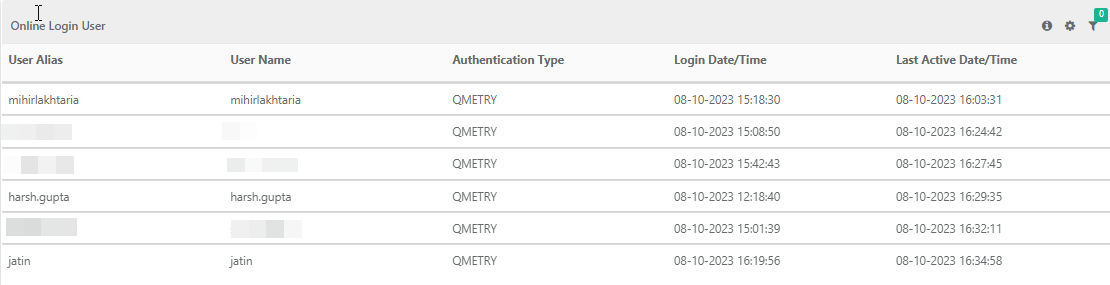
User Name: The logged-in username.
Authentication Type: It will show either QMetry/LDAP authentication type set for the user.
Login Date/Time: It indicates the time on which users logged into the system.
Last Active Date/Time: It indicates the time at which users start accessing the system after login.
User Last Login Detail
The report gives details of all Last Login Date and Time for each user.
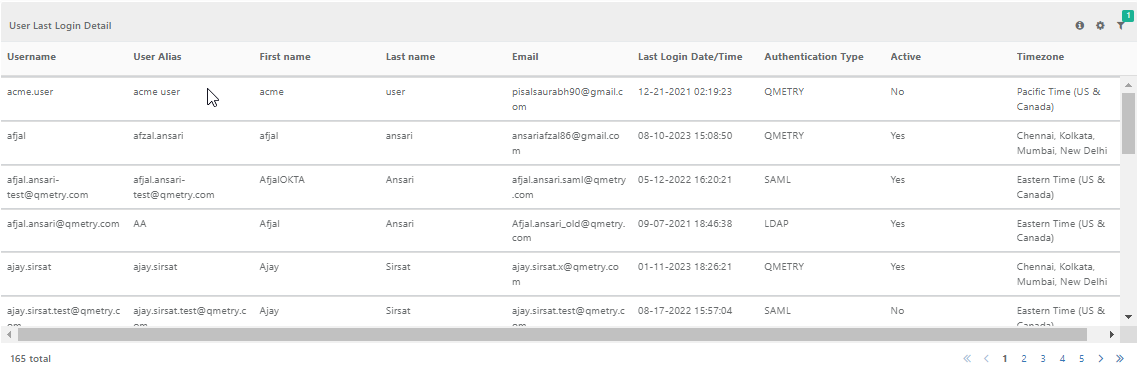
The report can be filtered with the following available fields :
Username
First Name
Last Name
Email
Authentication Type - QMetry, LDAP, SAML
Active - Active Users, Inactive Users
- Timezone
Count Of API Requests By User
The report displays number of Open API or Automation API calls made by each user for the selected time period. It helps admin track how many users are hitting the APIs on daily/hourly basis.
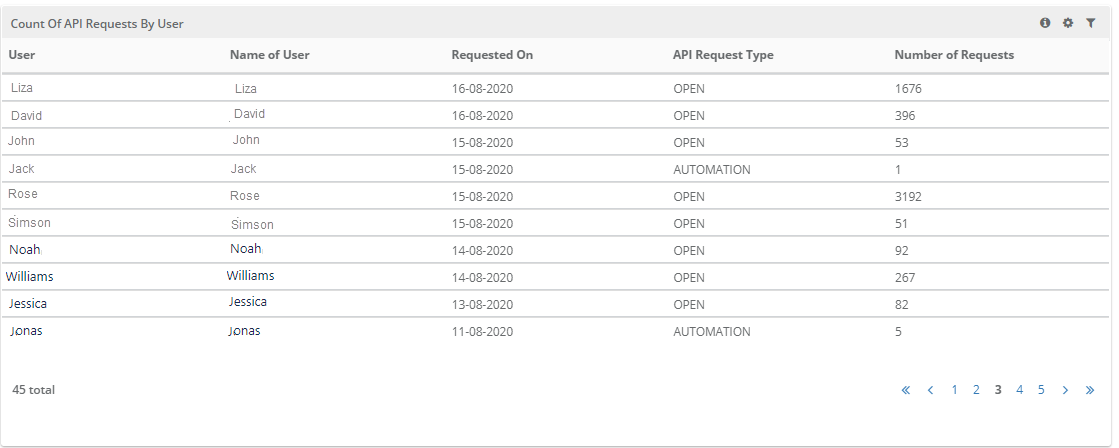
The report can be filtered on -
Start Date and End Date (maximum 1 month of date range can be selected)
Hour Duration
API Request Type
User (multi-select field)
User Project Role Summary
The report shows the list of all the users assigned to different projects along with their roles and their Active/Inactive status. Admin users can see the list of all the projects, whereas other users can see only those projects that have been assigned to them.
The report is useful to the admin to identify the impact of role change on the users.
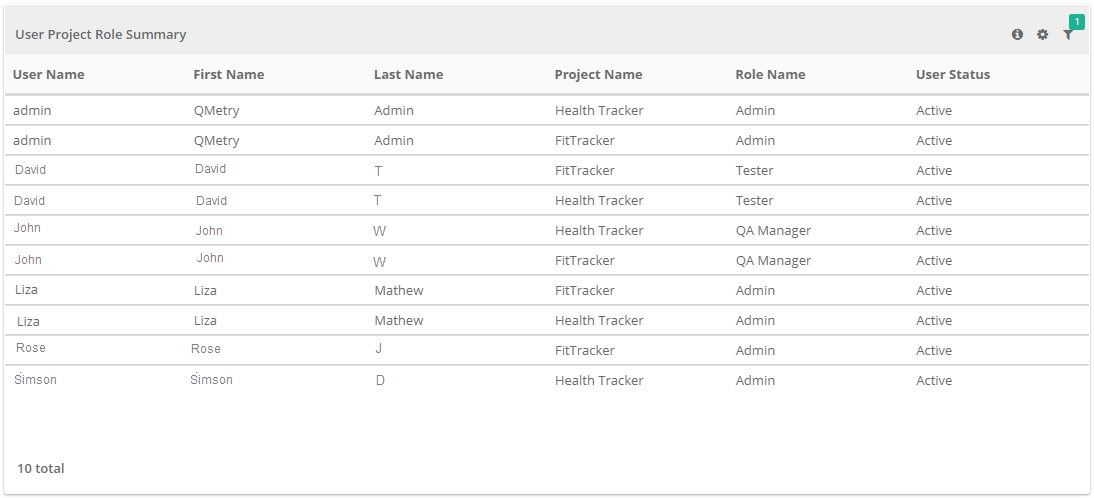
The report can be filtered on -
Project
User
Role
Usertype
Active
User Login Count By Date
The report gives the login count of a particular user on any date for the chosen date range.
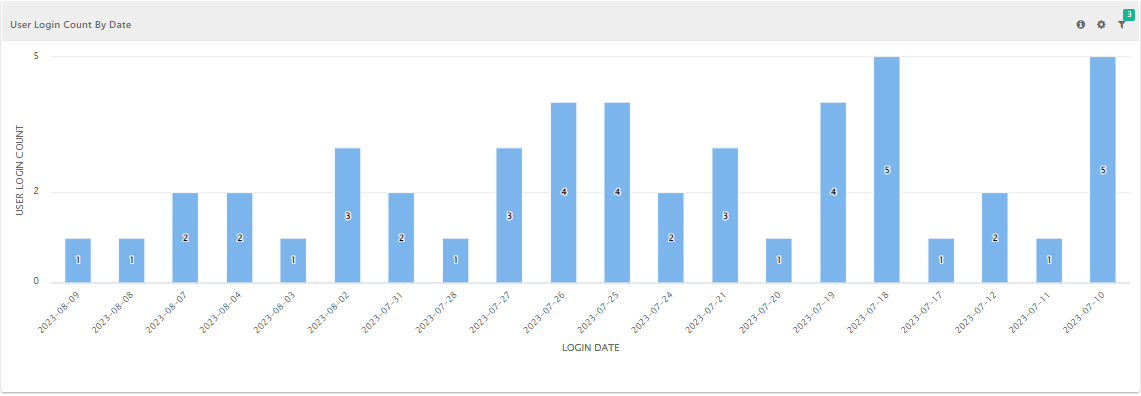
The report can be filtered with the following available fields :
User
Start Date - Default 30 days before
End Date - Default current date
Browser
IP Address
Back to QMetry All Products Help Page