Back to QMetry All Products Help Page
Test Run Report
Introduction
The Test Run report helps the testing team, the project manager, and the product owner understand the status of testing and the stability of the overall application. The report shows the count of test cases passed, blocked, failed, not executed, etc. It also displays the bugs encountered and logged during the execution phase.
Test Run report can be shared and discussed during retrospective as it contains detailed test execution status. The report can help organization visualize their current quality and plan ahead QA and Development activities timely.
For the selected Project, the Test Run Report shows how many tests were run over a period of Time, Sprint or Version. The report displays overall progress of test executions.
The report consists of two charts: Test Run Coverage of selected stories and Defect Coverage of selected stories.
By default, all the test runs are considered for calculating test run and defect coverage of selected stories. If you want to refine test run scope, then configure the report.
Select test runs you want to generate the report for. Multiple options are available to filter test runs and select the required ones.
Configure the Test Run Report
Open QMetry menu > View Reports > Test Run Report.
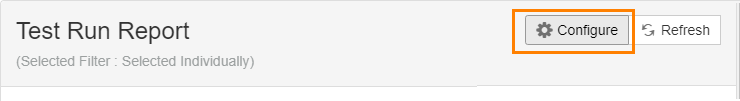
Click on the Configure button at top right.
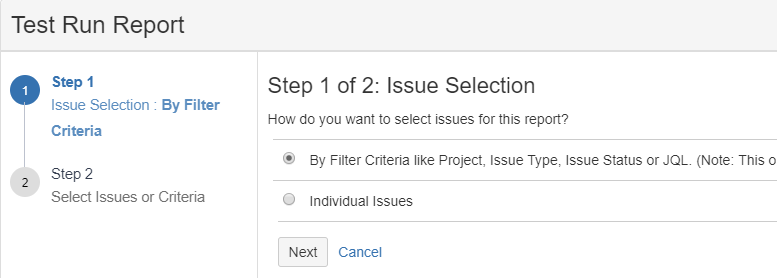
Step 1. Issue Selection
(A) By Filter Criteria like Project, Issue Status or JQL. Apply different filter or write JQL query to construct issue selection criteria.
Note: This option will update report dynamically if new issues are added matching the selection criteria.
Once the query/criteria is constructed for issue selection, users need not to bother about writing new queries/criteria to take care of any changes/addition/removal of issues. It will be taken care of automatically.
To search for issues with specific criteria, you can apply either Basic Search or Advanced Search.
Basic Search:
- Project
- Status
- Search By: You can search issues either with Issue Key or with Summary. Just select the parameter and enter a value in the adjacent search box.
Advanced Search:
You can use JQL to write the search query and get preferred issues as per the criteria. Read more about JQL syntax and how to use JQL for search.
(B) Individual Issues
The checkbox will be available to select individual issues as per your preference.
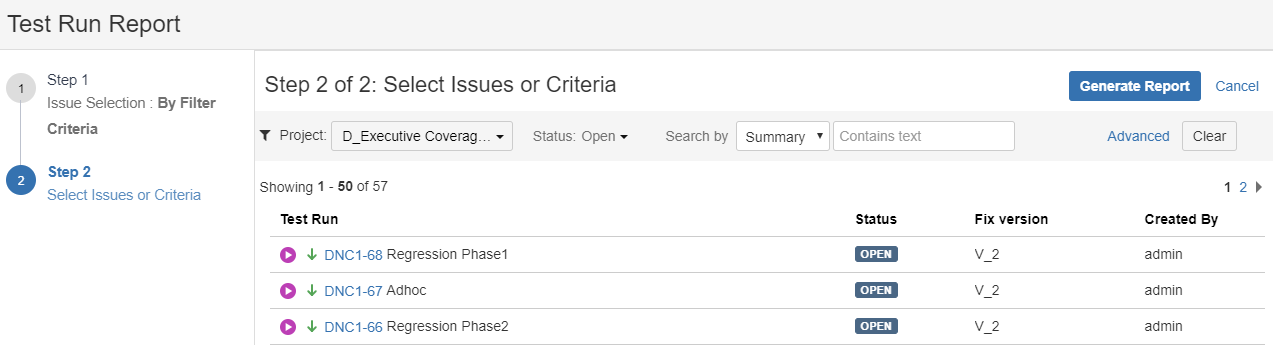
Step 2. Select Issues or Criteria
If you have selected (A) above, then apply filter and click Next.
If you have selected (B) above, then select individual issues by selecting the checkbox. Even you can apply filter here and then select required issues.
Select test runs you want to include in report and click on the Generate Report button at the top right.
On the basis of test runs selected here, the report will be generated.
Test Case Result
The bar chart displays the count of Test Case execution results of test cases covered understories. The report shows the count of Test Cases Passed, Blocked, Failed, Not Executed, etc.
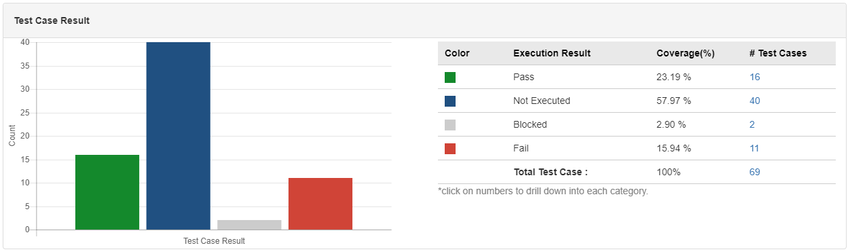
Once you generate the report, you can see that the counts in the table are clickable.
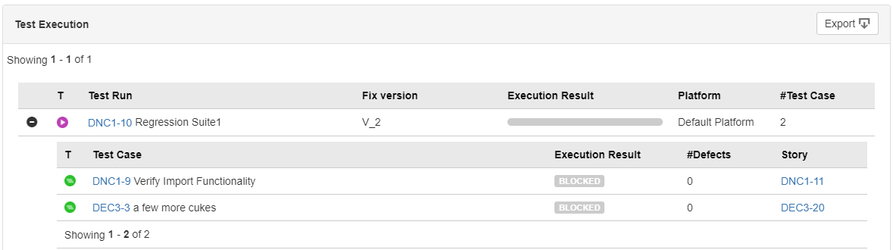
You can drill down each Execution Result and view contents of the test cases covered in the Execution Result.
You can open individual Story page in Jira.
The records are expandable. You can drill down further from test runs to test cases.
Export Test Execution Report: You can drill down to the individual category and export the details related to that category into Excel file by clicking on the Export button.
Defect of selected Test Run
In QMetry for Jira server version 3.x, the bar chart displays Priority wise (High/Medium/Low) count of defect linkages for the test runs. These are the bugs encountered and logged during the execution phase. Once you select test runs as described above, you can view the Defect of selected Test Run report.
You can filter the report further by its Test Case Status. Select the required option on the Test Case drop-down menus above the chart.
The counts in the table are clickable. You can drill down each Priority and view contents of the defects (bugs) covered in the test run as shown in the below image.
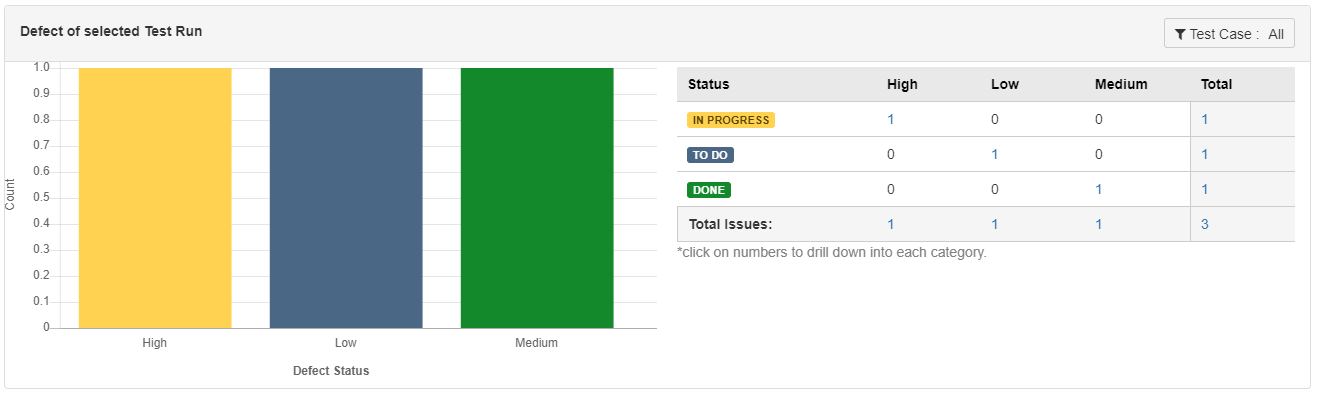
You can view the complete hierarchy of association – Bug – Test Run – Story – Test Case.
You can open an individual defect page in JIRA.
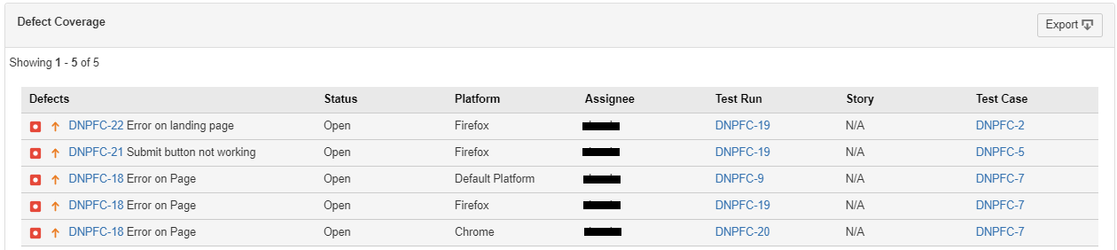
Export Defect Coverage Report: You can drill down to the individual category and export the details related to that category into Excel file by clicking on the Export button.
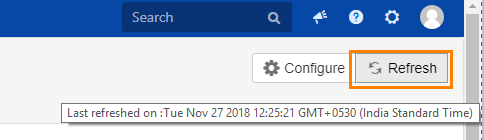
Syncing Report Data
Click on the Refresh button at the top to sync the report data with data updated in Jira. The data of stories and test runs, which you selected to generate reports, are updated with the latest changes. The report is generated anew with the updated data.
On hover, the Refresh button displays when the report was refreshed last.
Back to QMetry All Products Help Page