Back to QMetry All Products Help Page
How to see Execution Summary report?
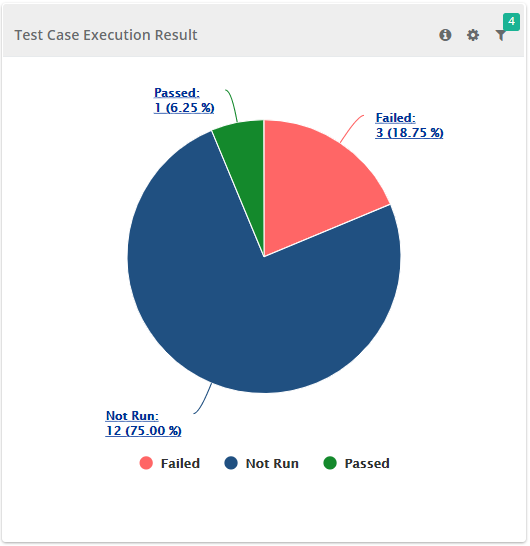
Execution Summary report provides standard industry matrices used by Product Managers, QA managers & Testers to get a summarized view on test executions & issues found during execution for combination of Project, Release, Cycle and Type. The summary graphs can drill further to get the details of test executions. The fields/columns can be grouped, sorted, selected (show/hide), resized. Graphical report can be exported in PDF or PNG formats and drilled down details can be exported in Excel or CSV format. The report can be generated for multiple projects and is accessible from Home > QMetry System Report > Execution Summary Report
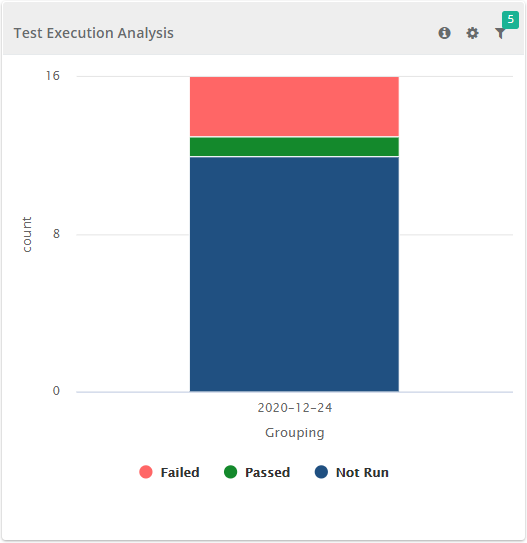
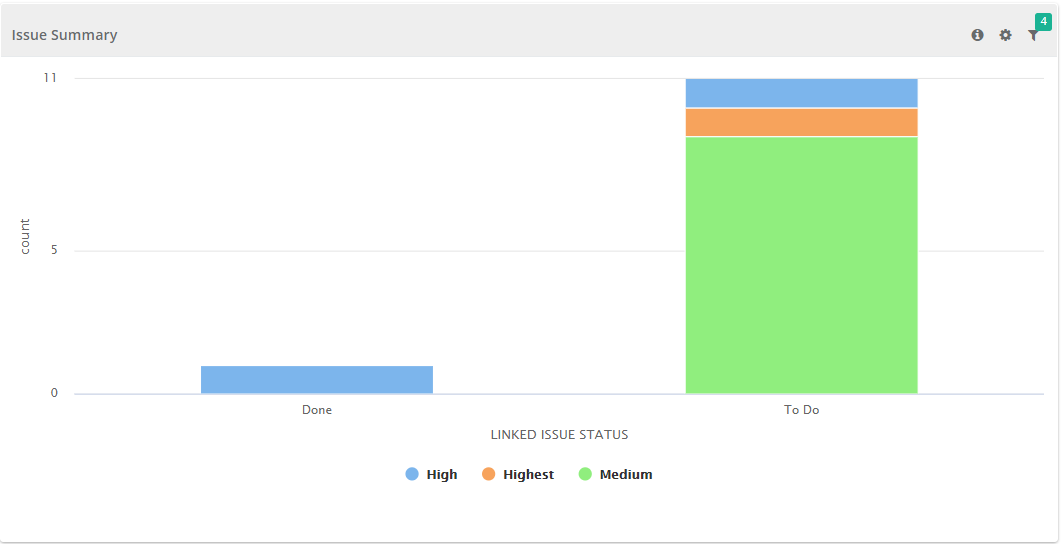
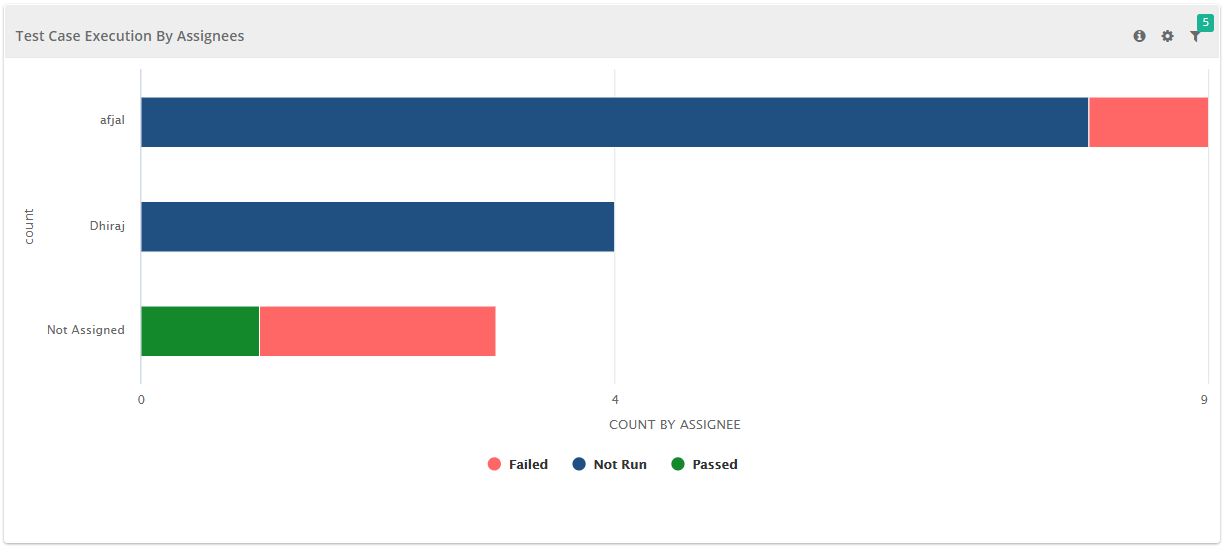
Execution Summary reports show the following matrices:
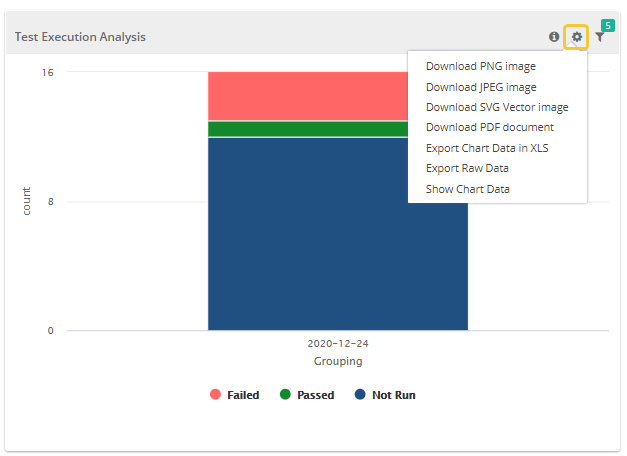
Download Chart
You can download the chart by clicking the ![]() icon. You can choose one of the many options provided in the list of download format.
icon. You can choose one of the many options provided in the list of download format.
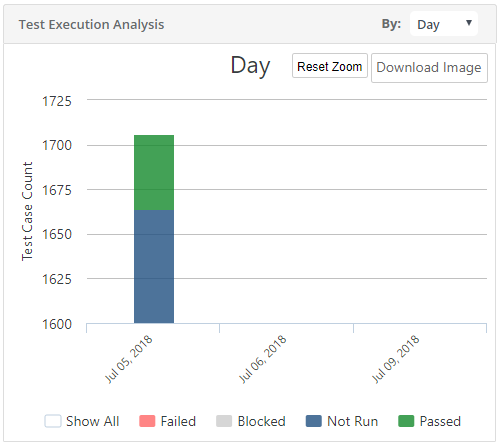
Zoom in the Bar Chart
You can zoom-in the chart view by just holding and dragging the mouse pointer to select a particular area on the chart. It enlarges that covered area on the chart and let you view more granular details. It gives you a closer look of the portion you selected on the chart.
To go back to the original view, click on the Reset Zoom button on the chart.
Back to QMetry All Products Help Page