Back to QMetry All Products Help Page
How to add Customized reports to Dashboards and Galleries
Adding Your Customized reports to Dashboards and Galleries
The Visual Analysis includes an optional feature that lets you create a visualization in the Thinkspace and then add it as a new panel in an existing Logi Dashboard in another report, or add it to a Visual Gallery.
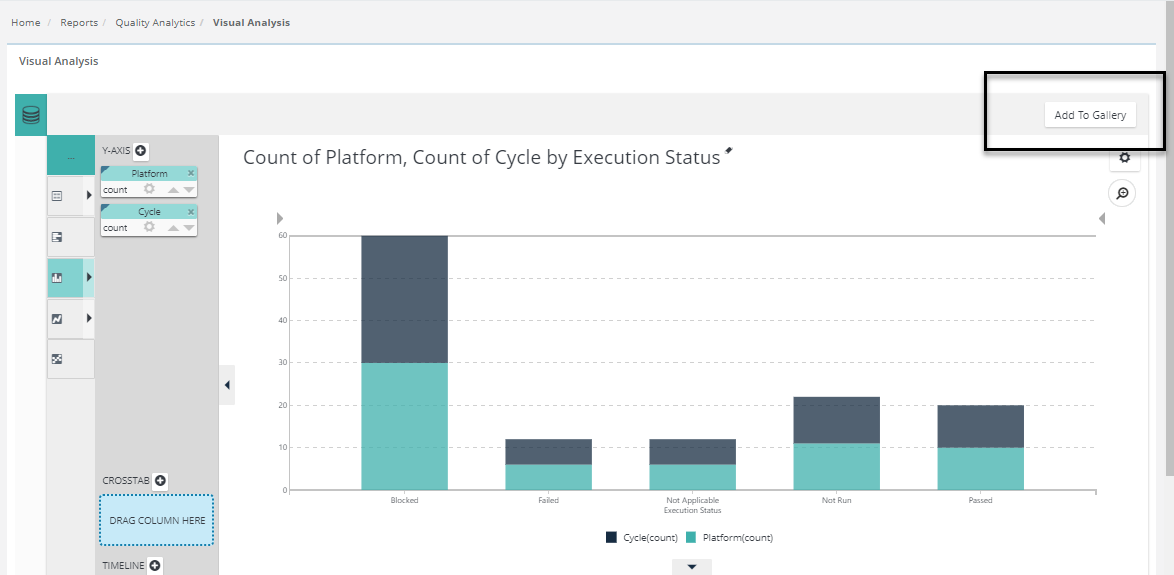
It will say to : "Add to Gallery" >> Add panel.

It will go to : Add panel >> (Quality Analytics > Dashboard).

When configured for use with a Dashboard and the button is clicked, the visualization is added immediately as a new panel in the Dashboard, as shown above. Just before the visualization is saved, you'll be prompted for the Panel Title (with the chart title from the Thinkspace provided as a suggestion) and an optional description for display.
The new visualization thereafter appears in the Dashboard Configuration Page or the Visual Gallery, as shown above, just like any other resource, complete with a thumbnail image. The visualization can be removed from the visible dashboard panels and from the configuration page or gallery entirely, using the usual controls.
You can insert multiple charts into a Dashboard using this technique. For more information about Dashboards.

Back to QMetry All Products Help Page