Execution Summary
Execution Summary report provides standard industry matrices used by Product Managers, QA managers & Testers to get a summarized view on test executions & issues found during execution for combination of Project, Release, Cycle and Type.
- Test Suite Execution Summary by Status: The report displays execution summary of the test suites based on execution status of its test case runs.
- Platform Summary By Test Suites: The report displays execution summary of the test case runs for a combination of Platform and test suites.
- The report can be generated by applying filters Project, Release, Cycle, Start Date, End Date.
- The report includes summary of archived test case executions.
- For eSignature enabled projects, the report shows count for Approved, In Review, Closed execution status.
The report can be generated for multiple projects. You can select more than one project on the drop-down.
- If only Project is selected (without Release and Cycle), then the latest version of test case will be considered in the report.
- If Release/Cycle is selected along with Project, then the test case version associated to that Release and Cycle will be considered in the report.
Execution Summary reports show the following matrices:
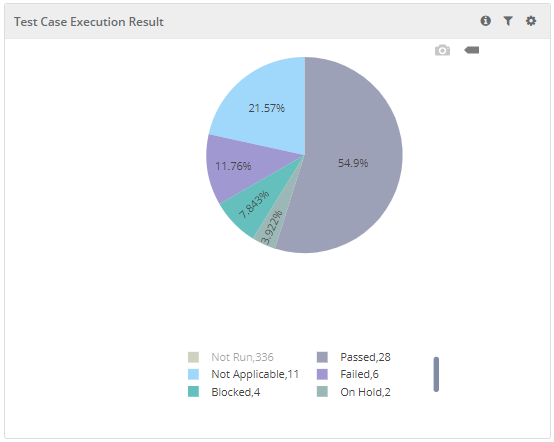
Test Case Execution Result
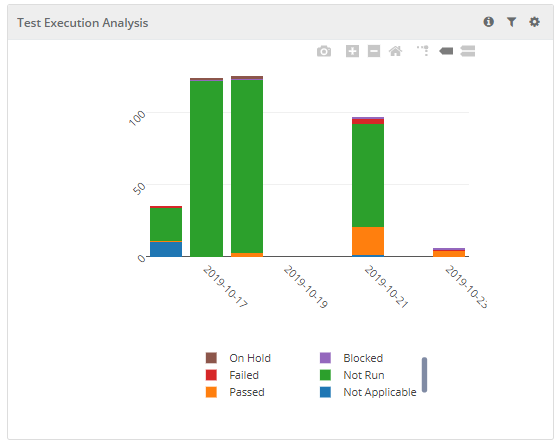
Test Execution Analysis
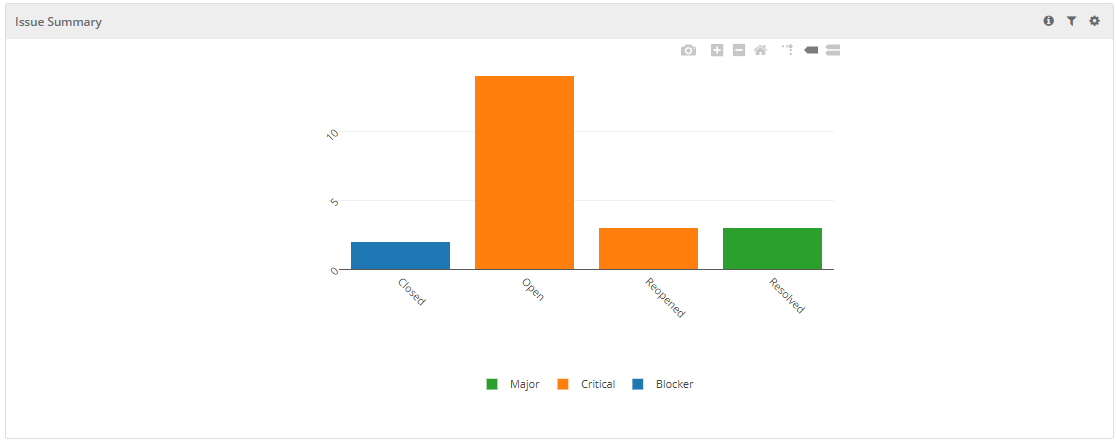
Issue Summary
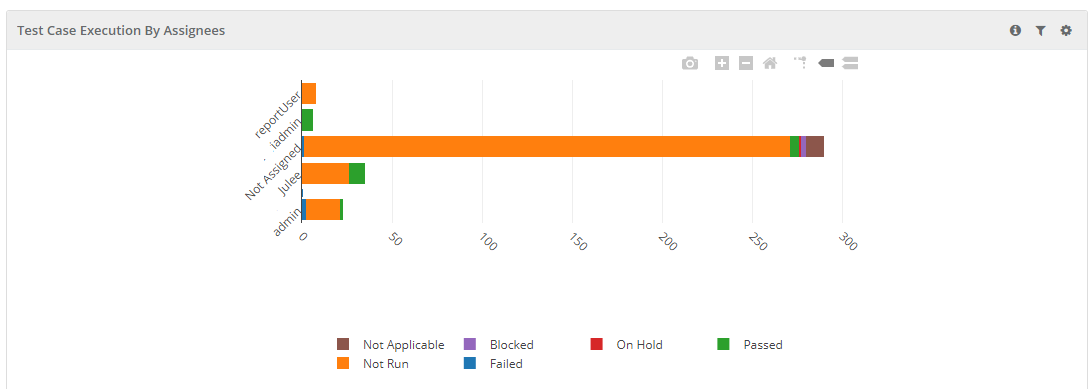
Test Case Execution By Assignee
Test Suites Execution Summary
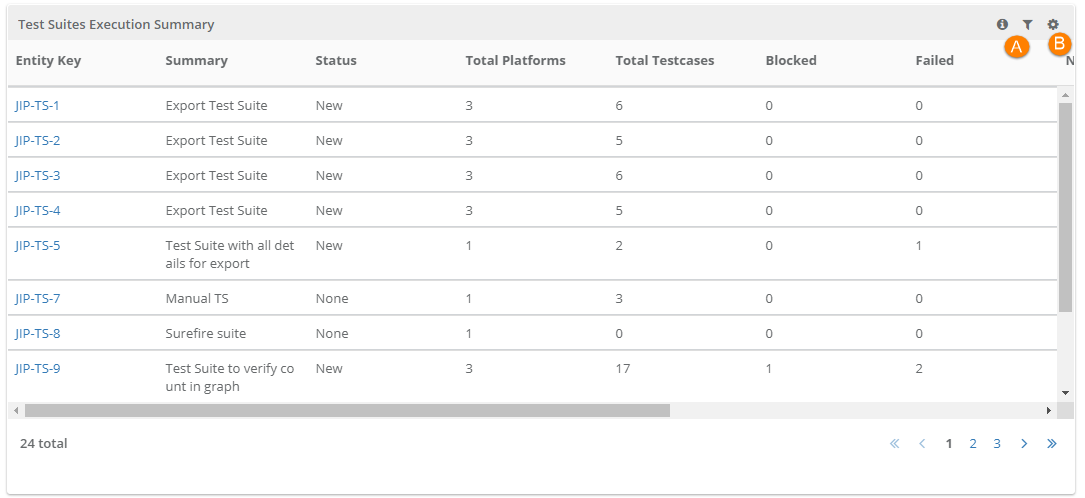
The Test Suites Execution Summary report displays the execution summary of test suites based on the execution status of its test case runs.
- This report is generated by applying filters on Project, Release, Cycle, Start Date, End Date and Execution Type.
- It includes Execution Summary of archived test case executions.
- For eSignature enabled projects, the report shows count for Approved, In Review, Closed execution status.
This report displays overall test suite execution status so that users do not need to open each test suite to view overall execution status of it. This report is helpful for QA Leads and Managers as they can view execution status of test cases under individual test suites quickly without opening each test suite. For example, a test suite has 10 test cases within it - out of which 5 test cases are "Passed", 2 test cases are "Failed", and 3 test cases are "Not Run".
The Total Platforms and Total Test Cases columns in report displays the respective association with the test suite.
- Project
- Release
- Cycle
- Start Date: Test Suite created date is considered for the filter.
- End Date: Test Suite created date is considered for the filter.
- Execution Type

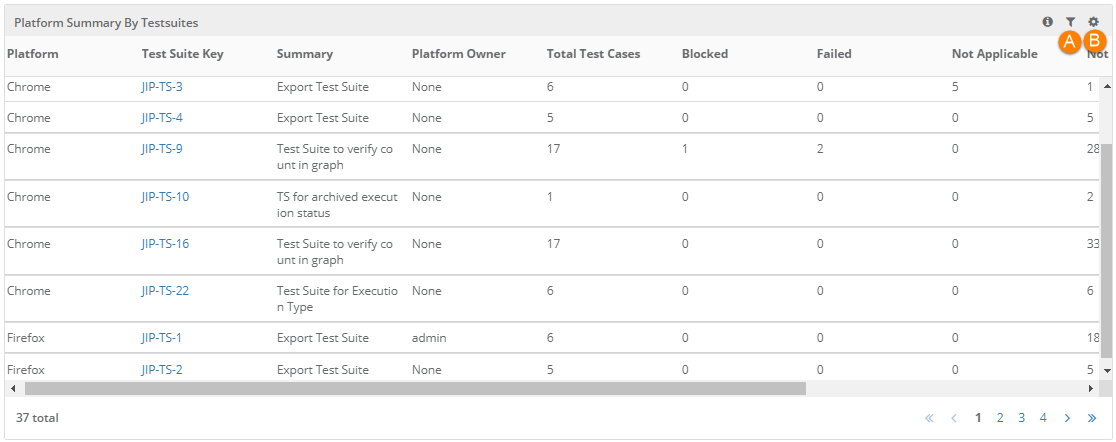
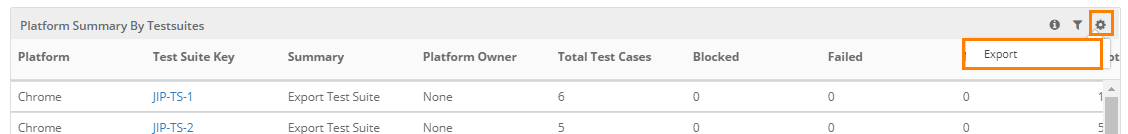
Platform Summary by Test Suites
The report displays execution summary of the test case runs for a combination of Platform and test suites.
- The report can be generated by applying filters Project, Release, Cycle, Start Date, End Date, Platform, and Platform Owner.
- The report includes Execution Summary of archived test case executions.
- For eSignature enabled projects, the report shows count for Approved, In Review, Closed execution status.
- The report displays Platform Summary of all platforms including archived platforms.
- Project
- Release
- Cycle
- Start Date
- End Date
- Platform
- Platform Owner
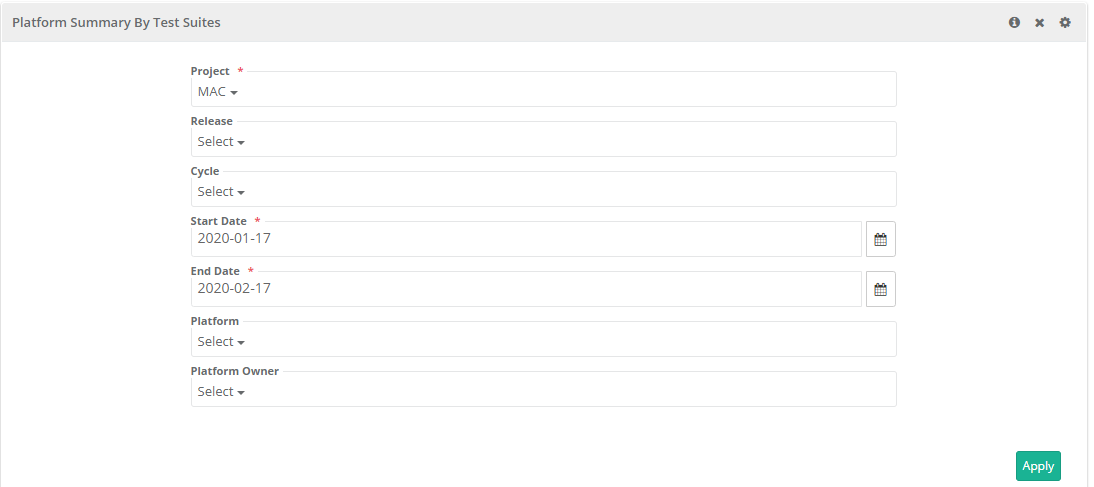
Filter Report:
Click on the Filter icon  on the individual chart to generate the report as per requirement by applying multiple filters.
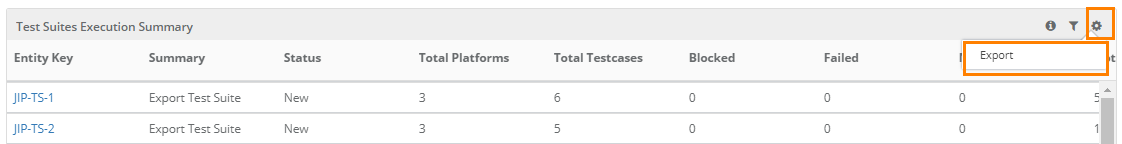
Export Chart in CSV:
To export the individual chart, click on the cog icon on the chart and select Export.
Download Chart
You can see the camera icon to to download the chart. The download functionality makes it easier for users to save charts as images with PNG format.
Zoom in the Bar Chart
You can zoom-in the chart view by just holding and dragging the mouse pointer to select a particular area on the chart. It enlarges that covered area on the chart and let you view more granular details. It gives you a closer look of the portion you selected on the chart.
As an alternative, you can use zoom in / zoom out icons.
Drill Down the Chart
You can view the tabular format of the graphical representation. Drill down the chart by clicking on the required portion/bar of the chart. It displays the details in table - rows and columns.
To download the report in CSV, click on the download icon at top right.
Then check the Scheduled Task section from where you can see the progress and download the report.
Schedule Emails to Send Reports
You can share updated reports on regular basis to stakeholders. QMetry offers the flexibility to schedule emails that will contain PDF of report details.
To schedule outbound emails at particular frequency, click on the Schedule button for the report that you want to share. The report details will be sent in PDF to recipients as per defined schedule.
The Schedule icon turns green as soon as the email is scheduled.
Schedules: The Schedules tab is located adjacent to the Scheduler tab. Click on the Schedules tab to view the history of scheduled reports.