QMetry Insights Reports
Note: QMetry Insight module will only be visible if the user has the View and Modify rights for QMetry Insight.
The QMetry Insights module consists of Query Builder. The query builder is used to create custom queries and add filters to generate reports accordingly. This document includes details about how to create Custom Reports.
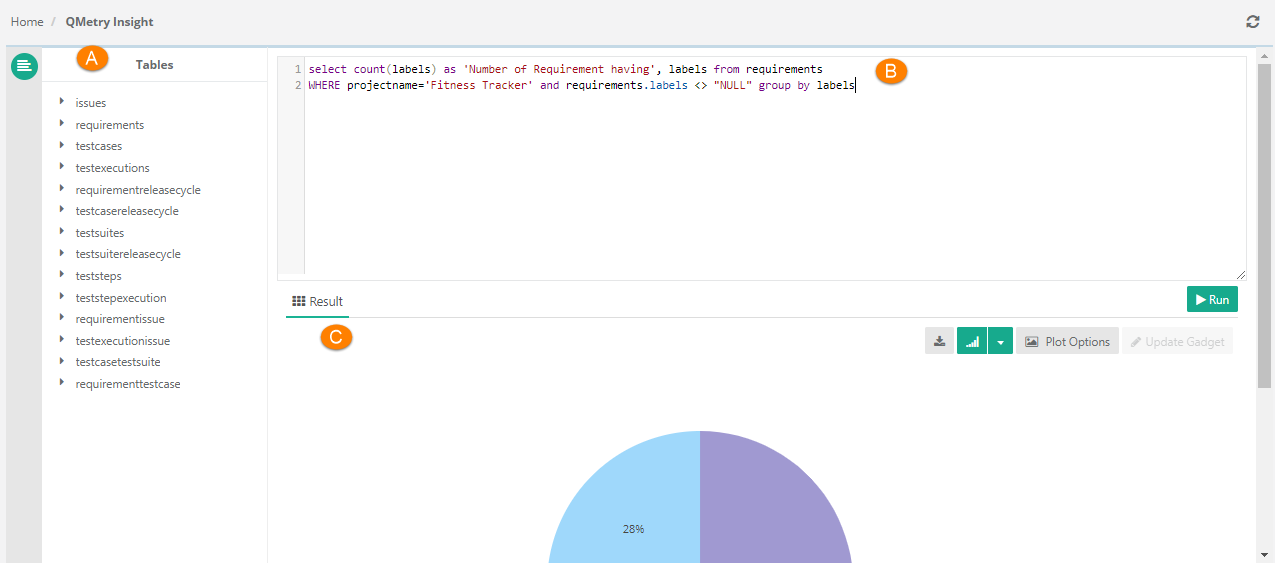
The screen is divided into three parts:
A. View Report Schema DB Tables
B. Query Builder
C. Result panel
View Report Schema DB Tables
A database schema which is separate from the actual QMetry DB containing a snapshot of your synced data is available for you to write custom queries.
- The query returns a maximum of 500 records or rows. Gadgets are generated on the first 500 records.
- Complete reports data is available in the reports export.
- The schema does not show the real-time data; the reports will be generated as per the last synced data.
- Expand tables to view its fields. Expand the fields further to view their datatype and size.
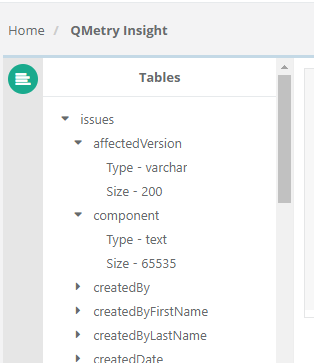
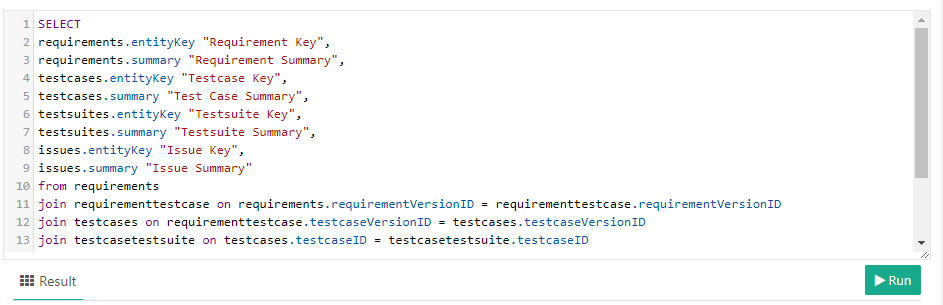
Using the fields, you can easily create custom queries and generate custom reports.
Note:
- SELECT * clause is not allowed. Column names need to be specified in the select statement.
- UPDATE and DELETE queries are not allowed.
- GROUP BY on text column is restricted. QMetry reporting tables store custom/udf fields of type lookup & multi-lookup as text fields. Hence GROUP BY on these fields are not possible.
- The gadgets other than table are generated on the 500 records.
- While creating queries, during execution the query will return just the first 500 records. However all data is available in the reports export.
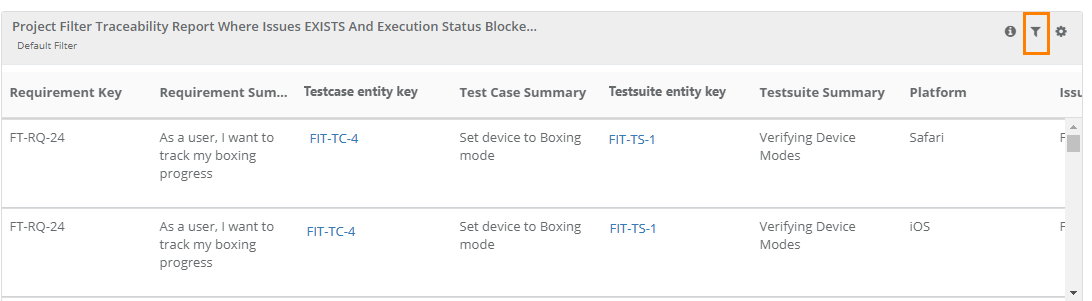
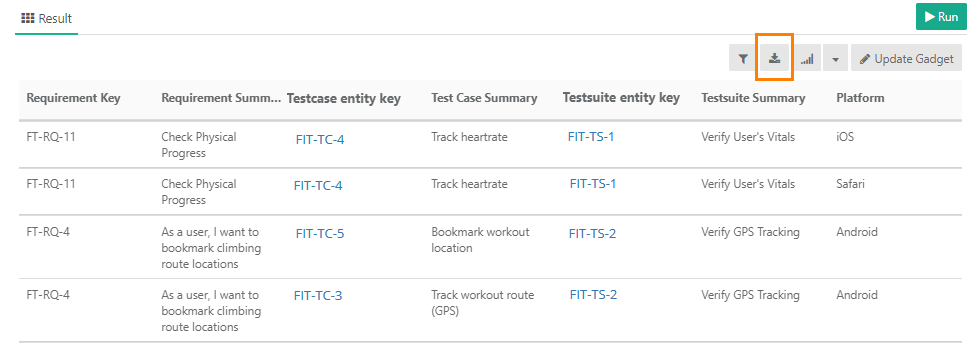
The test asset key will become clickable on the report if the column name contains the keyword (i.e. Entity Key), in any of the formats like - "entity key" or "entityKey" or "entity-key" or "entity_key" in it.
Once you edit the query using required fields, click Run to generate the report.
Apply Filters in Query
The query can have dynamic parameter(s) to be able to filter your data.
The following are system supported dynamic filter parameters that can be used in the query. With the inserted parameter in the report query, you will be asked to select the filter option before the report is generated.
For example, @FILTER.PROJECT is used in the report query. The user will be asked to select a specific Project to generate the report accordingly. Similarly to be able to filter by date use a @Filter.date
IMPORTANT :
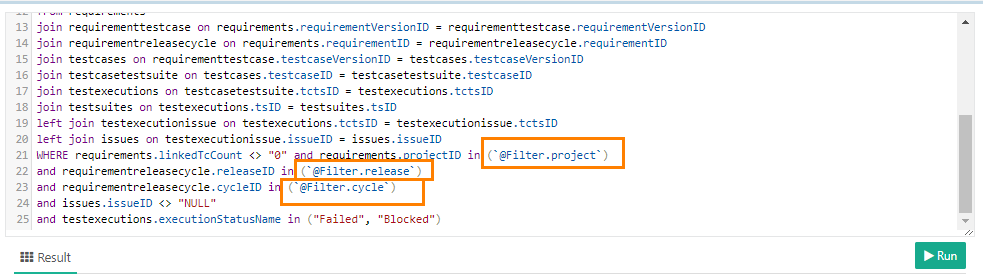
- Project filters must be specified in the format : `@Filter.project` ( ` is not single quote ' ).
- Project filter @FILTER.PROJECT is mandatory if you want to use any other system-defined filter except Date filter @Filter.date
- Project filter @FILTER.PROJECT and Release filter @FILTER.RELEASE are mandatory if you want to use Cycle filter @FILTER.CYCLE .
Filter | Description | Filters work on |
@FILTER.PROJECT | Filter report on a specific Project. | ID |
@FILTER.RELEASE | Filter report on a specific Release. | |
@FILTER.CYCLE | Filter report on a specific Cycle. | |
@FILTER.USER | Filter report on a specific User. | |
| @FILTER.BUILD | Filter report on a specific Build. | |
@FILTER.EXTERNAL PROJECT | This is the integrated Jira project with QMetry. | value |
| @FILTER.ISSUE PRIORITY | Filter report on Issue Priority e.g., Blocker, Critical, Major, etc. | |
| @FILTER.ISSUE TYPE | Filter report on a specific Issue Type e.g., Bug, Enhancement, New Feature, etc. | |
| @FILTER.ISSUE STATUS | Filter report on a specific Issue Status e.g., Open, Reopened, Resolved, Closed, etc. | |
| @FILTER.ISSUE OWNER | Filter report on the owner of the issue. | |
| @FILTER.TESTCASE PRIORITY | Filter report on Test Case Priority e.g., Blocker, Critical, Major, etc. | |
| @FILTER.TESTCASE STATUS | Filter report on Test Case Status e.g., New, Open, On Hold, Rejected, In Progress, etc. | |
| @FILTER.TESTCASE LABEL | Filter report on Test Case Label e.g., Sprint1, Sprint2, etc. | |
| @FILTER.TESTCASE TYPE | Filter report on Test Case Type e.g., Functional, Performance, Regression, etc. | |
| @FILTER.REQUIREMENT PRIORITY | Filter report on Requirement Priority e.g., Blocker, Critical, Major, etc. | |
@FILTER.REQUIREMENT STATUS | Filter report on Test Case Status e.g., New, Open, On Hold, Rejected, In Progress, etc. | |
| @FILTER.REQUIREMENT OWNER | Filter report on the owner of the Requirement. | |
| @FILTER.TESTING TYPE | Filter report on the Testing Type of the Test Case e.g., Manual, Automation. | |
| @FILTER.PLATFORM | Filter report on the Platform linked to the test suite. | |
| @FILTER.JIRA ASSIGNEE | Filter report on the Assignee of Jira issue. | |
| @FILTER.JIRA REPORTER | Filter report on the Reporter of Jira issue. | |
| @FILTER.APPROVAL STATUS | Filter report on Test Case Status when the eSignature feature is On. | |
| @FILTER.JIRA RESOLUTION | Filter report on the Resolution marked in Jira. | |
| @FILTER.TESTSUITE STATUS | Filter report on the Test Suite Status after the execution. | |
@Filter.execution status | Filter report on the Test case execution status. | |
| @Filter.date | Filter report on date. e.g. to specify execution start start date : testexecutions.tcexecutionEndTime >= (`@filter.date Execution Start` ) | |
- If any of the above filters is marked in the report query, then the user will be made to select the filter option to apply it to the report.
- Depending on how the user has selected or retrieved the data - a single select or multi select dropdown is generated.
When filters are inserted in query and you run the report query, the Parameters pop-up appears with Filter parameters on it to filter the report data.
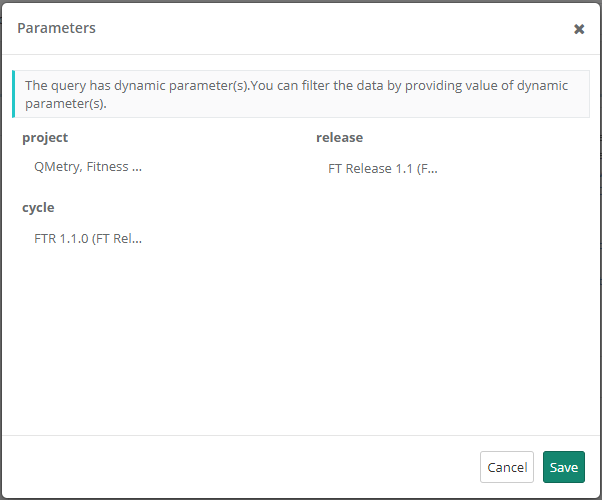
The values/criteria provided during query execution will be saved and will be applied as default to the gadget added on dashboard.
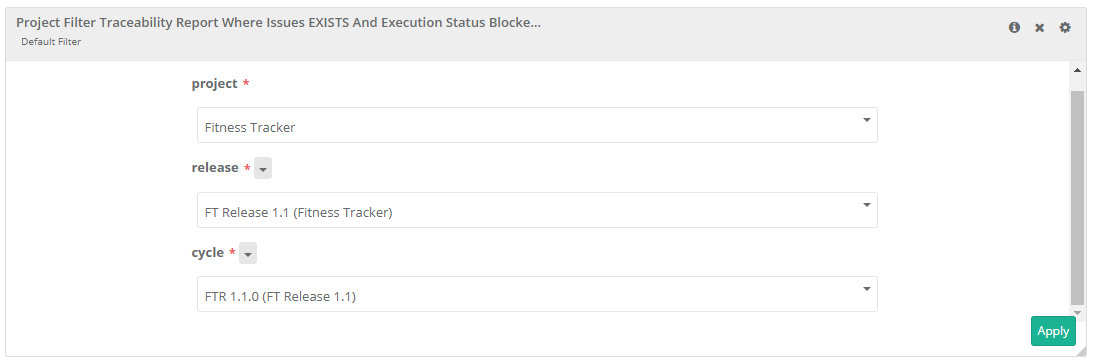
Once the filter is applied to the report, users can modify the same from the dashboard.
Note : If a filter is not applied, then the report shows data of the current project and of last 1 month |
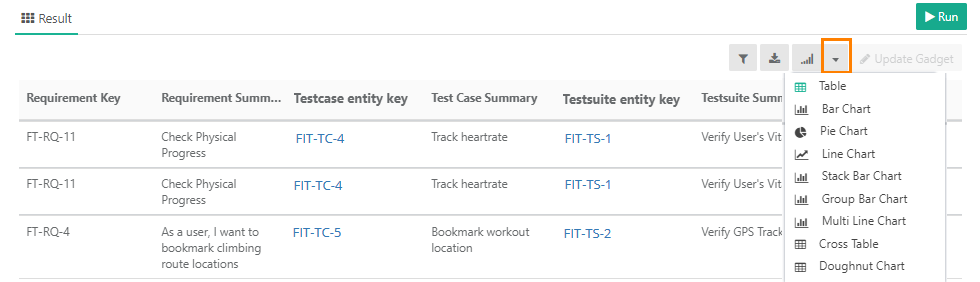
Types of Reports
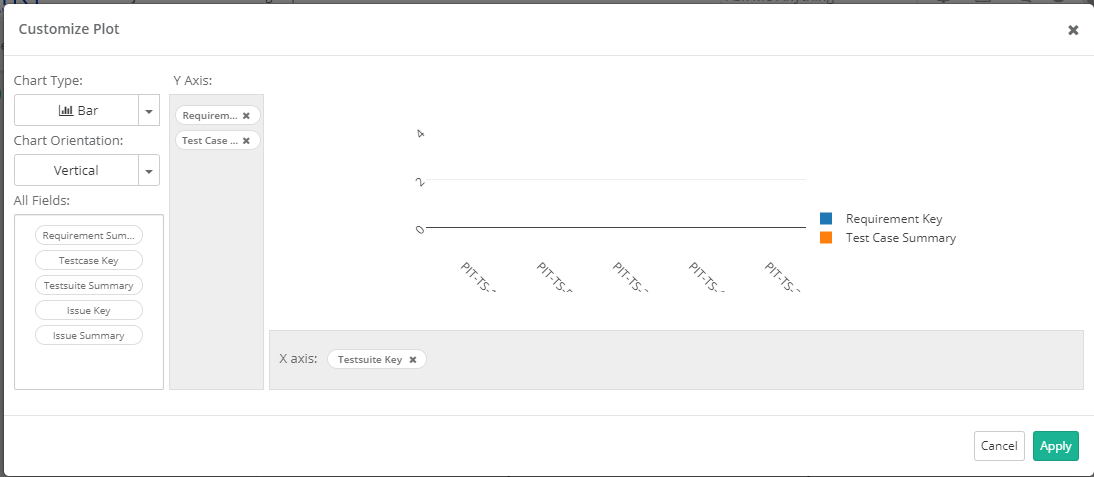
On the Result panel, select the report type you want to preview the report in.
The Customize Plot screen pops up.
You can design your custom report by selecting Chart Type, Chart Orientation, and fields on X-axis and Y-axis.
Click Apply once you are done applying your choices.
You can see the report is generated below the report query on the QMetry Insights screen.
The Plot Options button becomes visible for the report. To make changes in the report, click on the Plot Options button.
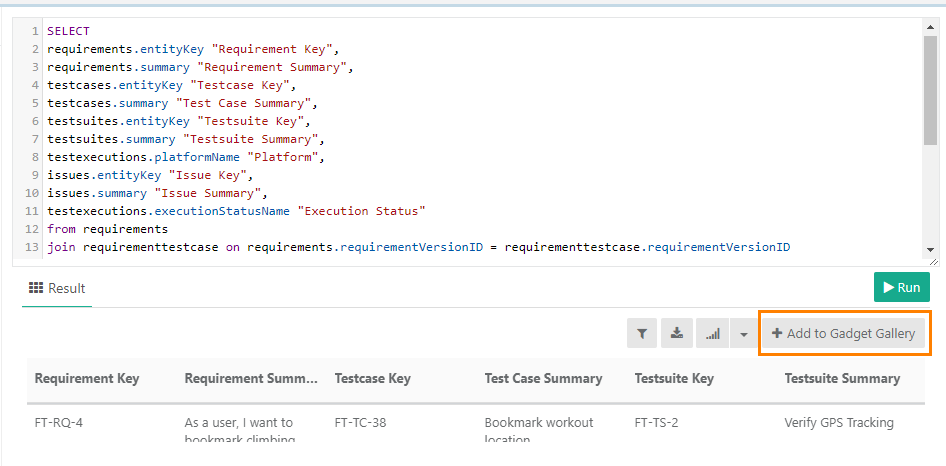
Add to Gadget Gallery
You can write query and run it to generate the report. Different types of charts can be generated and then added as a report to dashboard using Add to Gadget Gallery button.
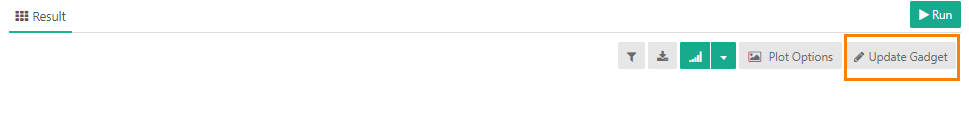
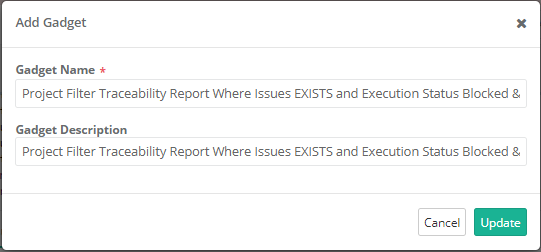
Update Gadget
Once you modify the query, you can save the gadget with updated Gadget Name and Gadget Description.
Click on the Update Gadget button on the Result section.
Export Report
On the Result section, click on the Export icon to export the report in CSV format. The excel file can contain maximum 1000000 records in one time export.
Individual Gadget data can be exported into CSV with the same limit.
Best Practices
- Rights to write custom queries must be provided only to those users who have knowledge of writing SQL queries and can access any QMetry data, as there is direct access to all QMetry data in Report Schema DB.
- The custom SQL queries must always include a project filter specified as : @FILTER.PROJECT. This will prevent the recipients of the shared report gadgets from inadvertently viewing data from other projects that they do not have access to.
- The custom SQL report queries after creation must be run and saved against a Sample Project, so that the report does not load with the data of an un-intended project.
- The Report DB has tables like testcase, testexecutions, etc. which now only have user IDs instead of the actual information of the users. This information should be queried by writing an SQL Join with user IDs from `users` table now available in the Report DB schema.