QMetry Dashboard
Note: QMetry Custom Dashboard module will only be visible if the user has the View rights for Report. Similarly, users can make any changes within the module only if they have the Modify rights for Report.
The Custom Dashboard provides you with an advanced and easy-to-use interface to quickly create your own Customized reports for category bases analysis. This generates "best-fit" charts for the report data automatically.
User can add System as well as Custom gadgets in Custom Dashboard. System gadget data will be real-time whereas Custom gadget data will be based on data available in reporting schema.
Note: The data in Custom gadgets will be displayed in accordance with the latest synced data.
Add a New Custom Dashboard
You can add new custom dashboards and also modify them as per requirement. A Custom Dashboard can be created using system gadgets, custom gadgets or shared gadgets.
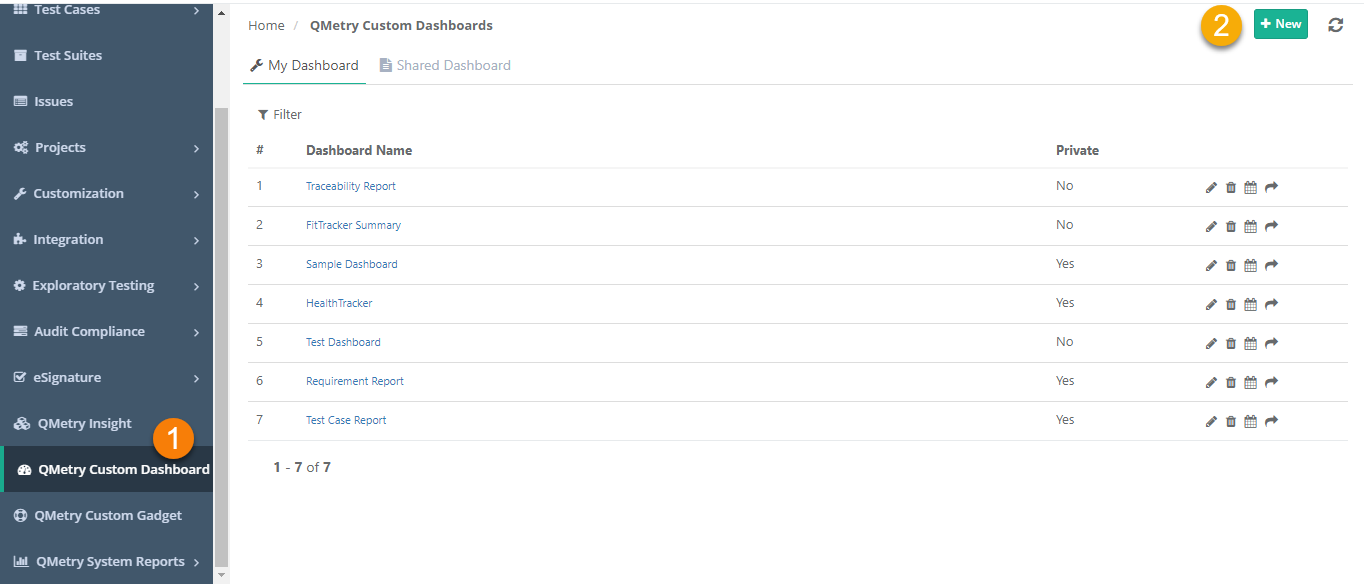
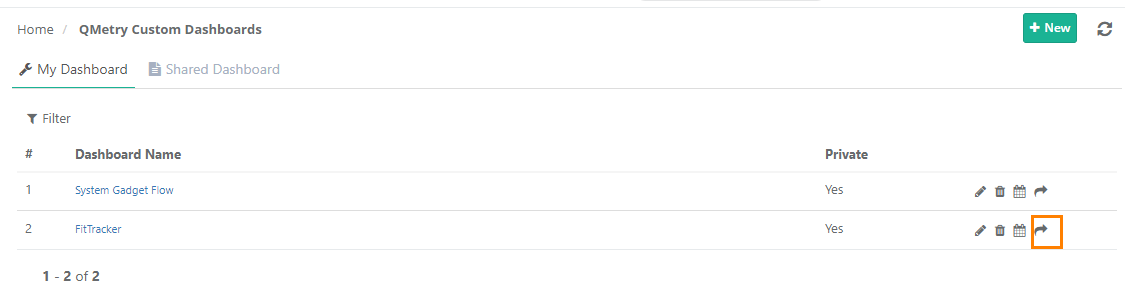
1. Click on QMetry Custom Dashboard on the navigation bar at left. The QMetry Custom Dashboards screen opens.
2. Click on the New button to add a new dashboard.
3. Give Dashboard Name and click Create Dashboard.
The list of available Gadgets are displayed. A Custom Dashboard can be created using system gadgets, custom gadgets or shared gadgets.
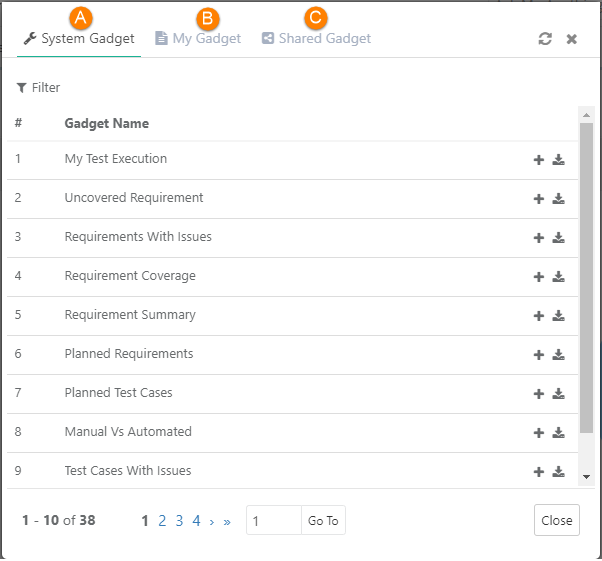
(A) Create Dashboard using System Gadgets: QMetry System Reports are available to add as System Gadgets. These predefined gadgets are neither be edited nor be deleted. System Gadgets can be drilled down to view the details in tabular form and download it.
(B) Create Dashboard using Custom Gadgets: Custom Gadgets are generated by the users and can be added to the dashboard. These custom gadgets can be edited as well as deleted.
(C) Create Dashboard using Shared Gadgets: Shared gadgets are those gadgets which are shared by other users. The user to whom it has been shared can just view the gadget and export it. They can not edit the gadget shared by other users.
Click Close once you are done adding the gadgets.
To add more gadgets to an existing dashboard, open the dashboard and click on the Add Gadgets button. Click on the + icon to add that gadget to the dashboard. You can add multiple gadgets at a time. You can also add a single gadget multiple times.
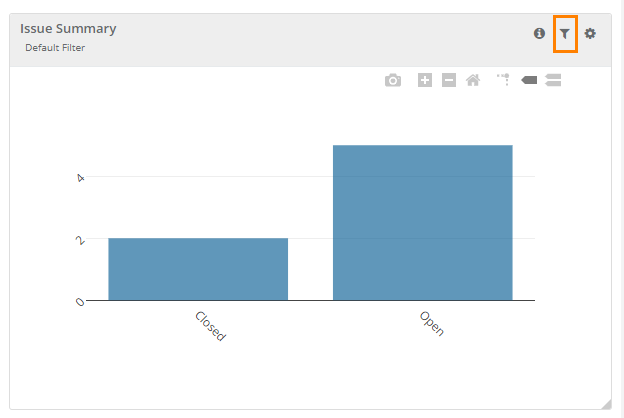
Filter Gadgets
The values/criteria provided during query execution will be saved and will be applied as default to the gadget added on dashboard.
1. To modify the default filter, click on the Filter icon for the gadget.
2. Select/deselect filter values and click Apply.
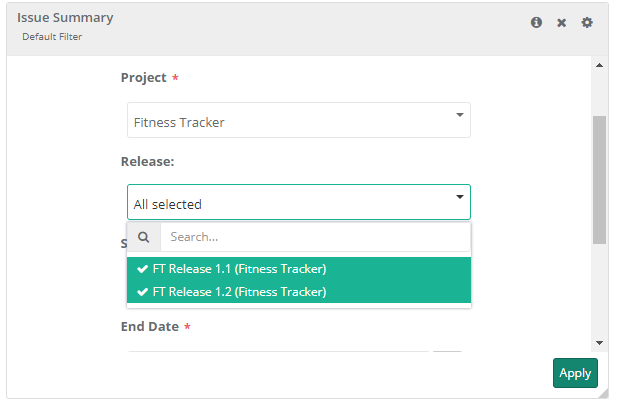
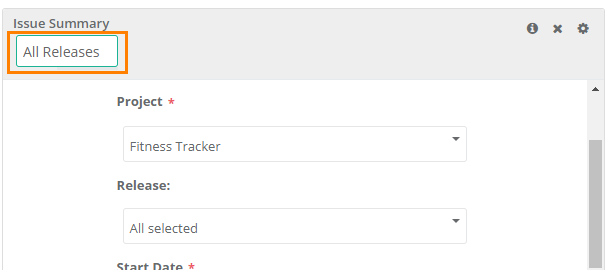
3. You can also tag the applied filter to identify it.
Drill down System Gadgets in Dashboard
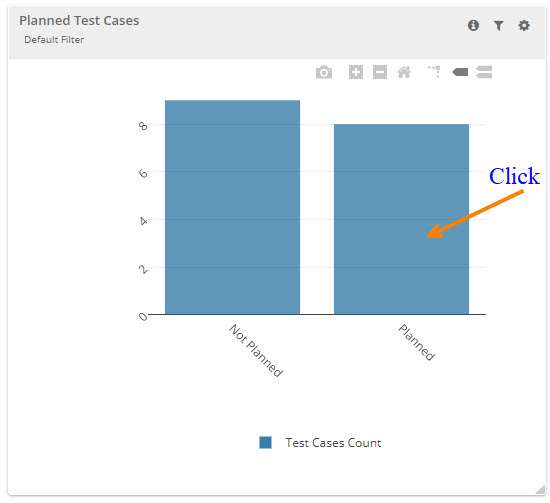
System Gadgets can be drilled down to view the details in tabular form.
Step 1. Click on the graph section that you want to drill down.
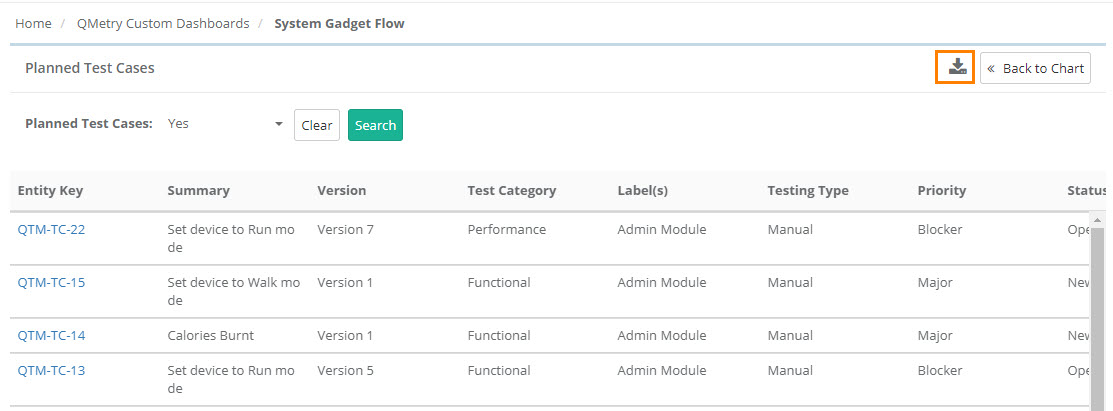
The details of the gadget is shown in the tabular format. You can also download the details in CSV format.
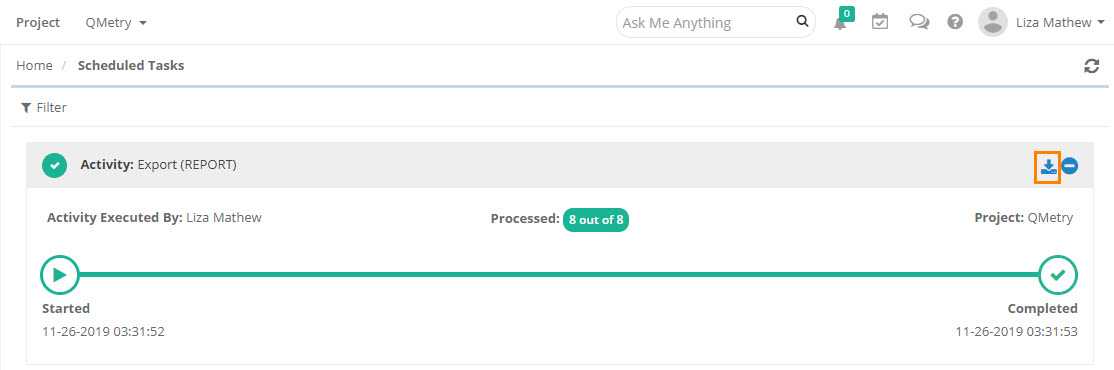
Step 2. To download the report, click on the download icon at top right.
Step 3. Check the Scheduled Task section from where you can see the progress and download the report.
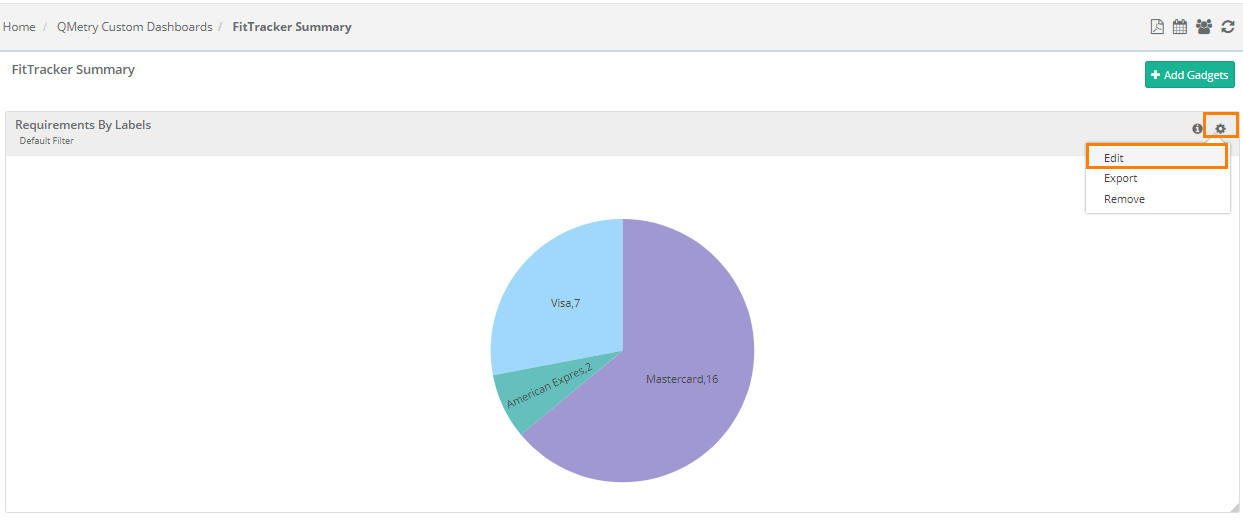
Edit Gadgets
Click on the cog icon of a gadget and click Edit.
It navigates you to the QMetry Insights module. The screen is divided into three parts:
A. View Report Schema DB Tables
B. Query Builder
C. Result panel
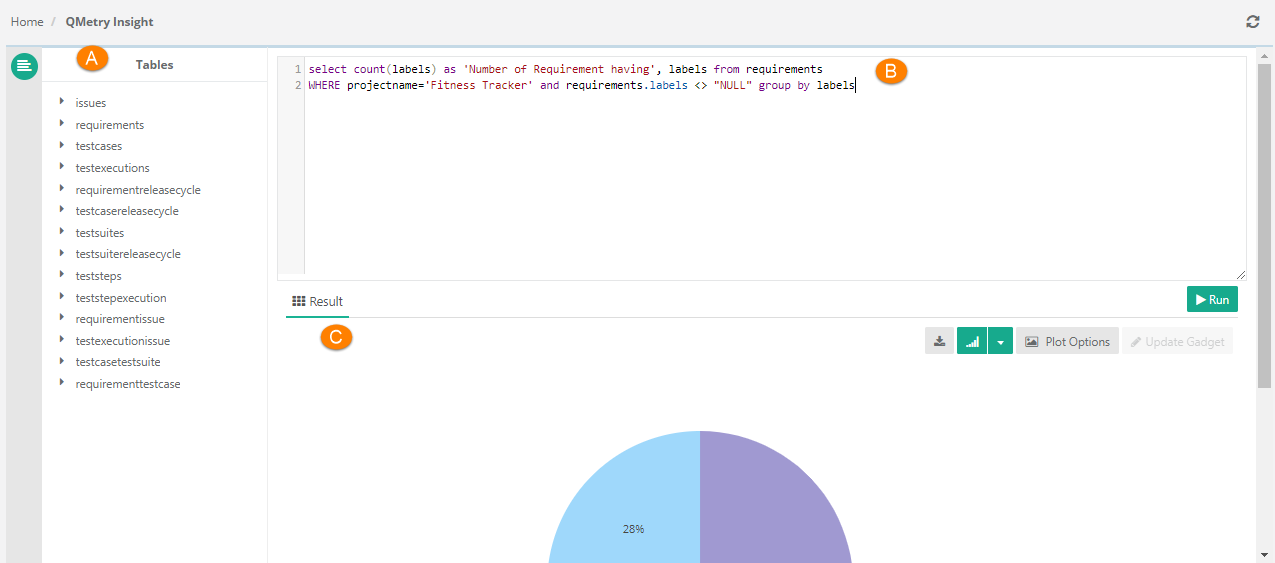
Refer to QMetry Insights for more details.
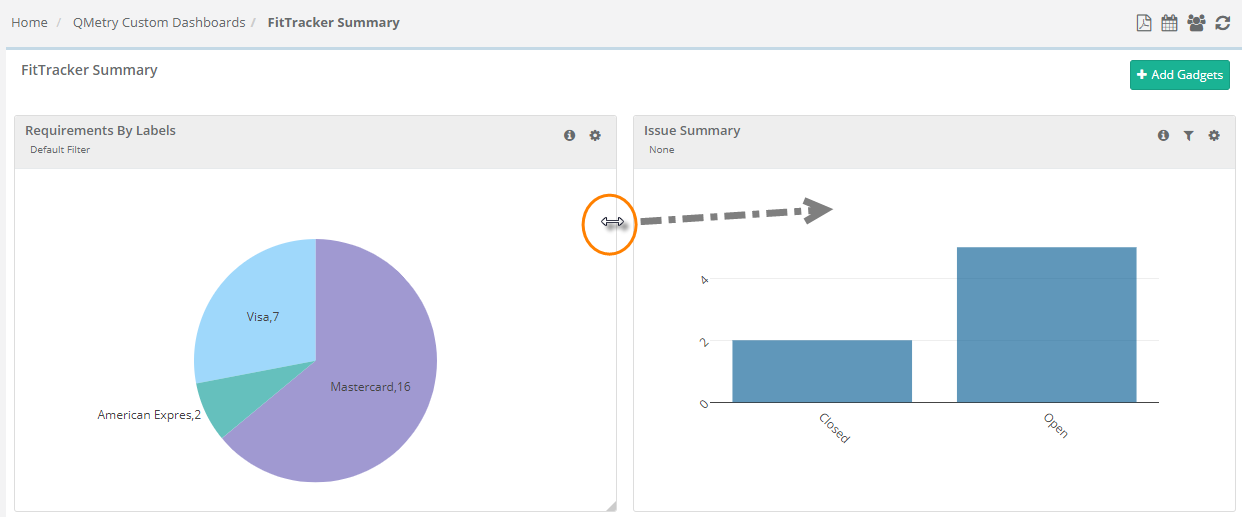
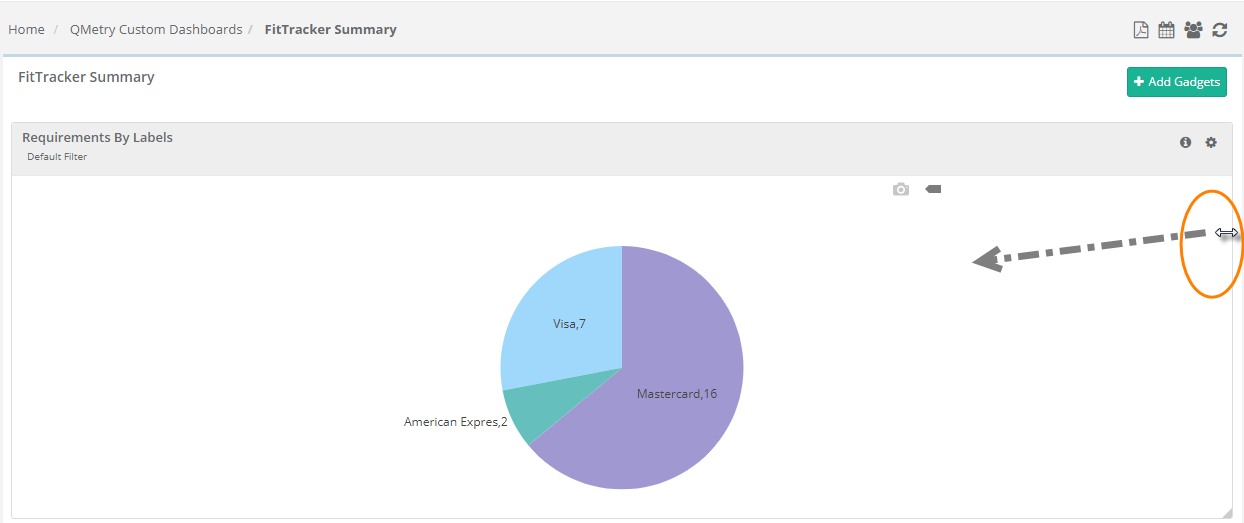
Resize Gadgets in Dashboard
You can drag the edges to resize the gadgets on dashboard. You can organize the gadgets by maximizing/minimizing their size.
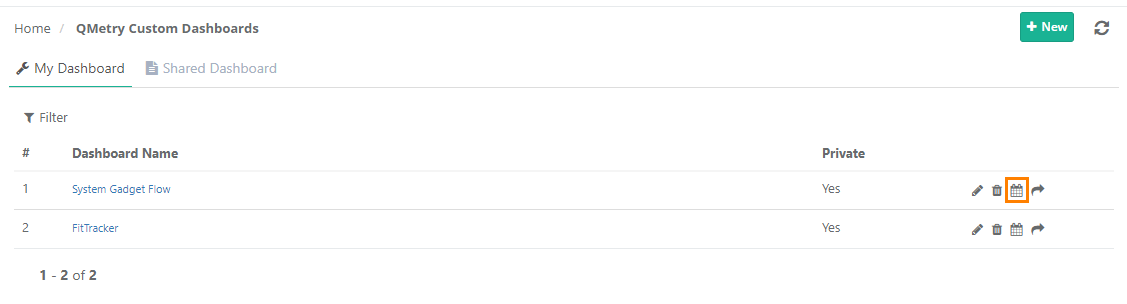
Schedule Dashboard
A. Click on the calendar icon to schedule the dashboard and email to recipients.
Note : All System Dashboards except "My Dashboard", can be scheduled.
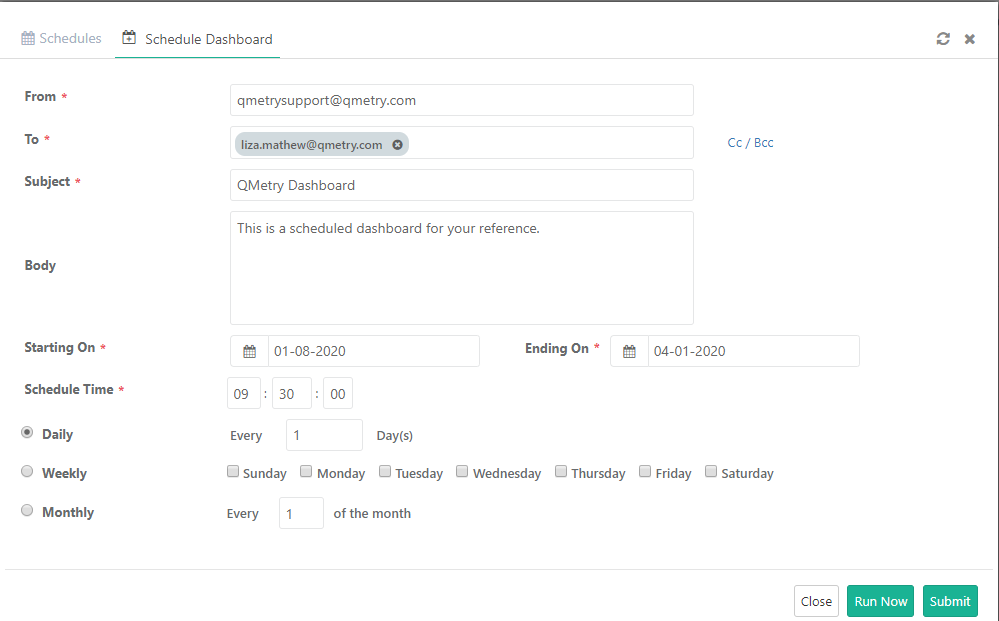
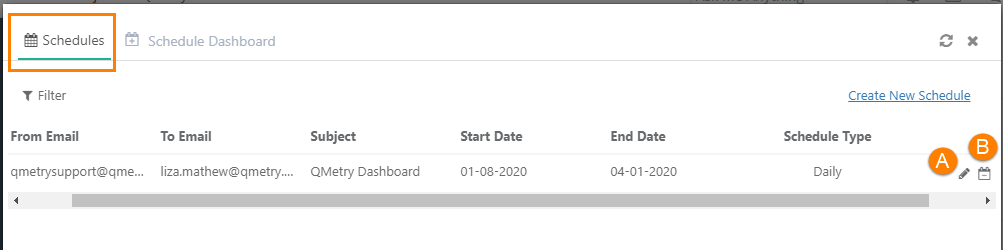
The dashboard details will be sent in PDF to recipients as per the defined schedule. You can edit or delete the scheduled details from the Schedules tab as shown below.
A. Edit the Schedule
B. Delete the Schedule
Share Dashboard
User who has created a dashboard can share it with other users. Once a dashboard is shared, the user, with whom it has been shared, will be able to see that dashboard under the Shared Dashboard tab.
- The shared dashboard will appear in accordance with the filters applied to it by the dashboard creator.
- The shared dashboard will be read-only for the users with whom the dashboard has been shared. This dashboard cannot be edited through UI or API.
- The shared dashboard can be exported in PDF as a whole. Individual gadgets on the dashboard can be exported into CSV.
Share Dashboard to Users
User who has created the dashboard can share it with other users using the user names in QMetry.
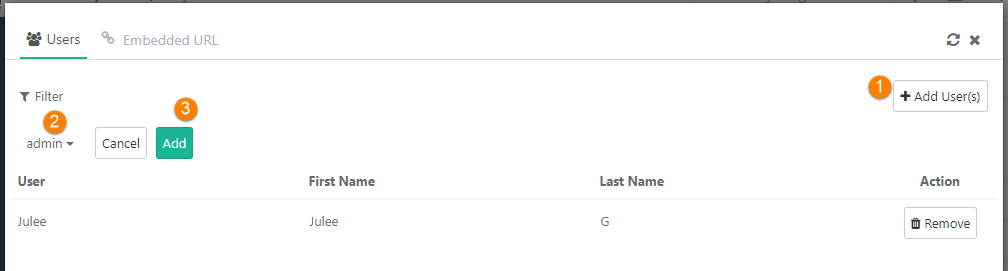
- Click Add Users.
- Select users on the drop-down list with whom the dashboard is to be shared.
- Click Add.

Share Dashboard through Embedded URL
User who has created dashboard can generate embedded URL and share the link. This link will allow access to this dashboard without any authentication in View mode. This link can be used to share the dashboard with other users or for integration with third party integrations.
Note: Embedded URL gives you access over live reports - graphical as well as tabular.
- Generate Embedded URL:
1. Open the dashboard and click the Share Dashboard icon on the header.

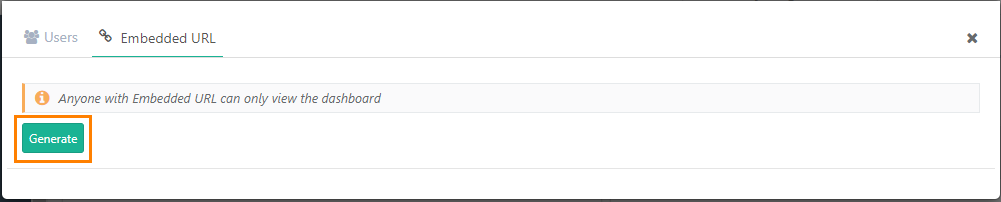
2. Open the Embedded URL tab.
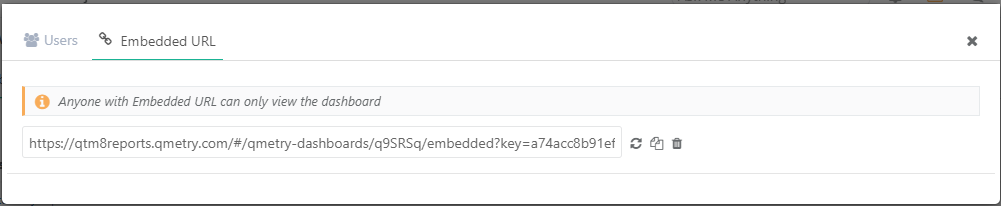
3. Click Generate to generate the embedded URL.
- Regenerate Embedded URL: If the user who has generated the Embedded URL wants to change the link, they can click on Refresh button to regenerate the link. This will make the older link disabled or invalid.
- Delete Embedded URL: If the purpose of Embedded URL is over, then the user who has created the dashboard can delete the URL by clicking on the Delete icon.
- Copy Embedded URL: To copy the generated Embedded URL, click on the Copy icon.
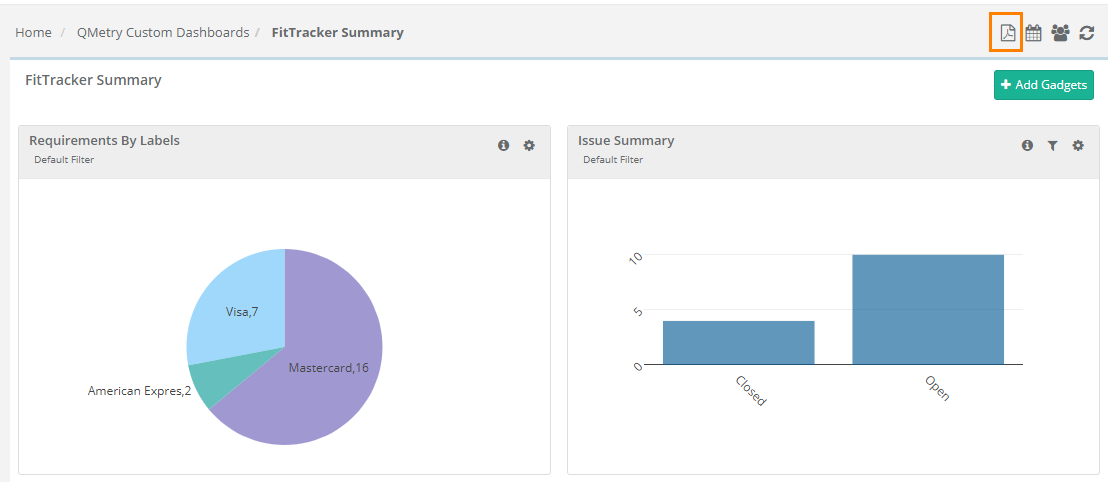
Export Dashboard
Open the Custom Dashboard and click on the PDF icon on the header to export the dashboard.
Note:
- Only Graphical reports can be exported through the Export as PDF option. For tabular reports, users have to export them individually in CSV.
- All reports are exported in the UTC time zone.