Back to QMetry All Products Help Page
Issue Analysis
Issue Leakage Rate and Issue Average Aging Reports will not display data for QMetry Projects that are synced with Jira Project, as these reports can be viewed directly in Jira.
Introduction
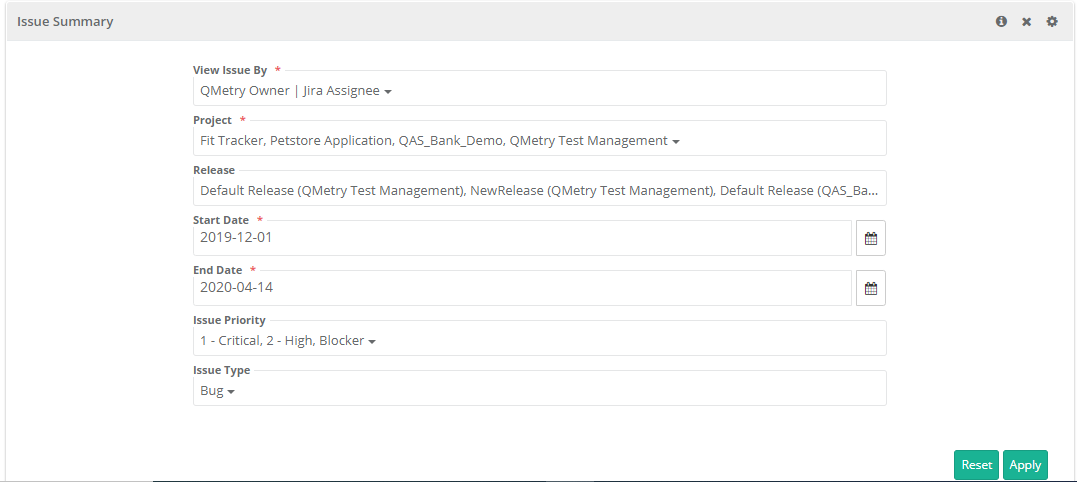
Issue Analysis reports can be generated for multiple projects. You can view the details pertaining across project.
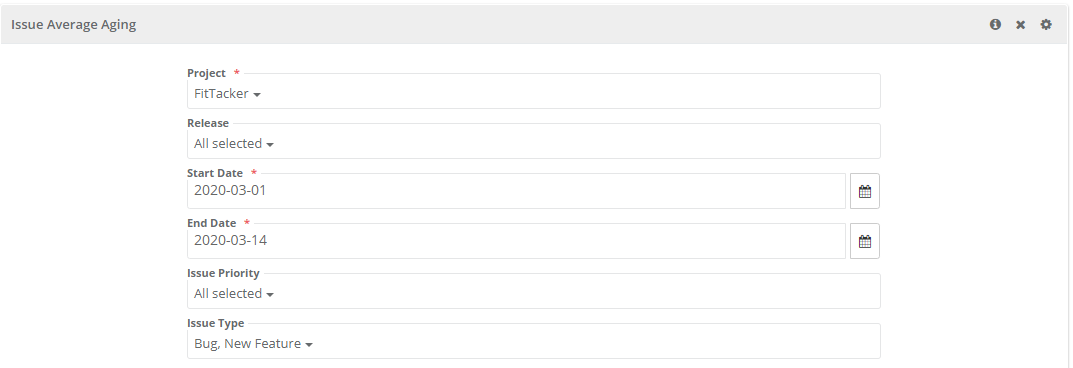
- Project: Select project to generate the report for. Users can select more than one project on the list.
- Release: Select either one release or "All" to consider all the releases on the list. Cycles on the graph will be shown based on the release selected here.
- Date Range: Provide Start Date and End Date either directly typing in the field or using the calendar to define the duration.
- Select Issue Priority and Issue Type to consider while generating the report.
Click on the Search button.
Issue Summary
You can generate the following types of reports to view Issue Summary. You can find the corresponding filters in the Filters menu.
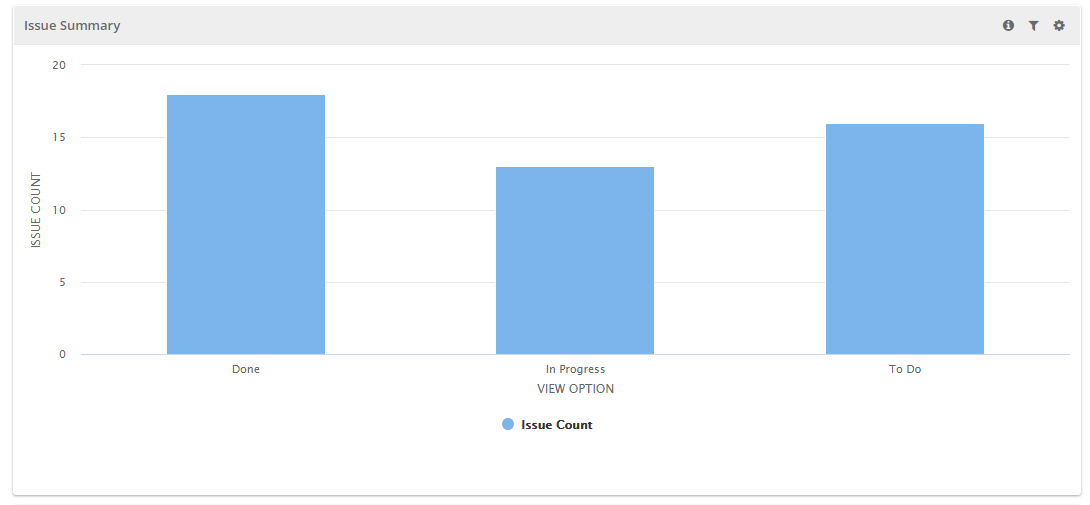
- Issue Summary by Workflow Status: The report shows issues by their workflow status i.e. the value in the Status field of issues.
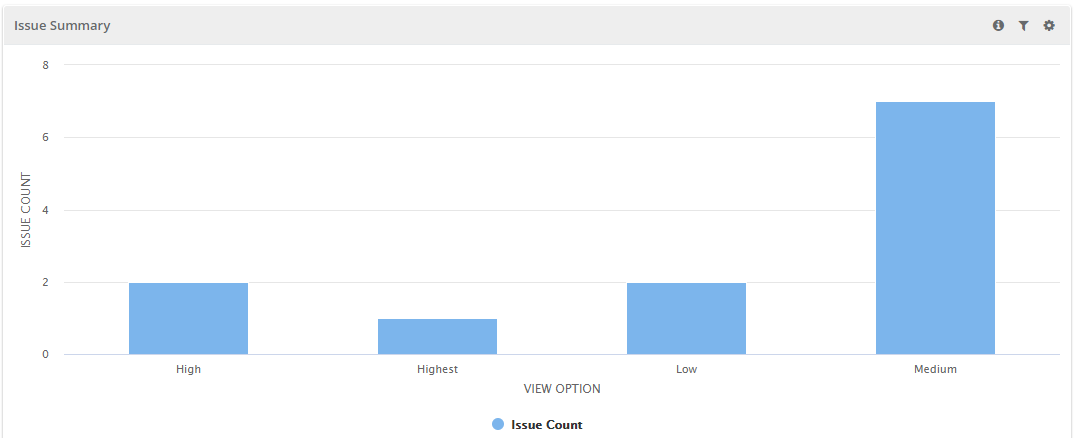
- Issue Summary by Priority: The report shows all Issues organized by priority.
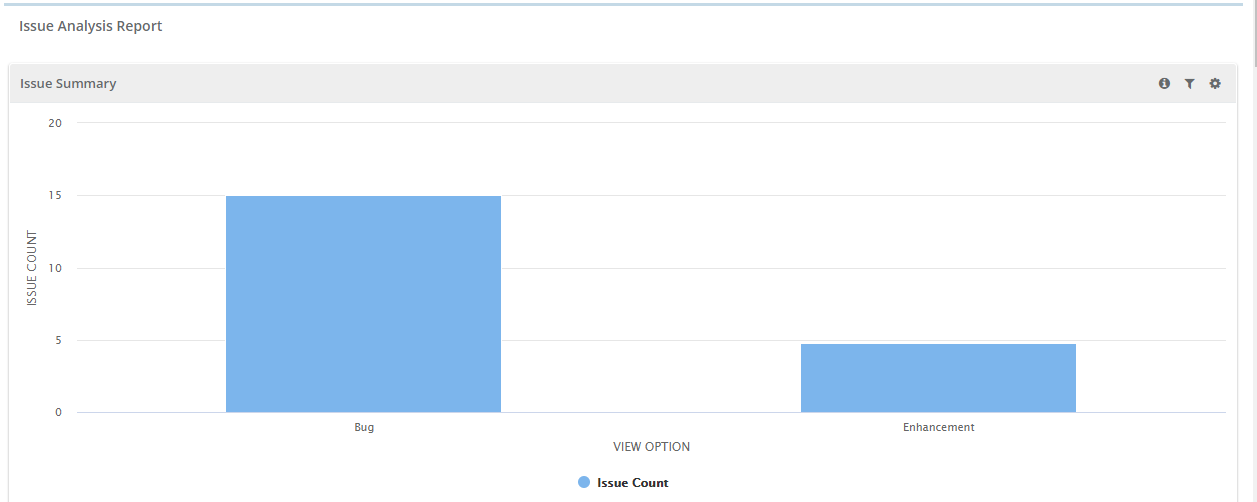
- Issue Summary by Type: The report shows issues categorized by type.This is the Type mentioned while creating an issue/logging a bug.
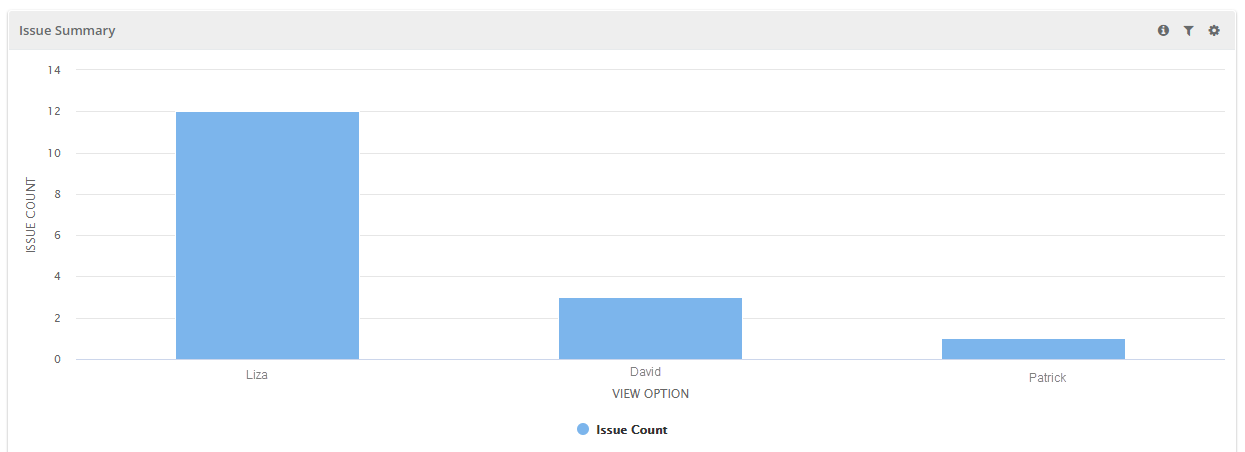
- Issue Summary by Assignee: The report shows all issues organized by their assignee - either QMetry Owner or Jira Assignee.
You can drill down the chart to view details in tabular format.
Issue Summary by Workflow Status
Issue Summary by Priority
Issue Summary by Type
Issue Summary by Assignee
Filter Report:
Click on the Filter icon  on the individual chart to generate the report as per requirement by applying multiple filters.
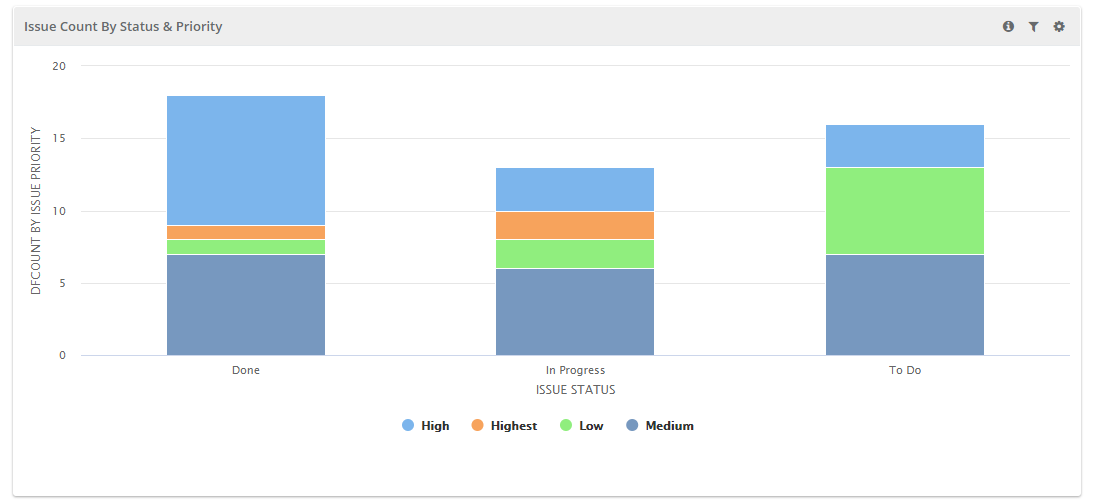
Issue Count by Status & Priority
As the name suggests, the report gives count of issues bu Status and Priority assigned to them. The legends are provided below the graph.
The legends are clickable. You can hide/show Priority displayed on the graph by clicking on the corresponding priority.
Users can drill down the chart to view details in tabular format.
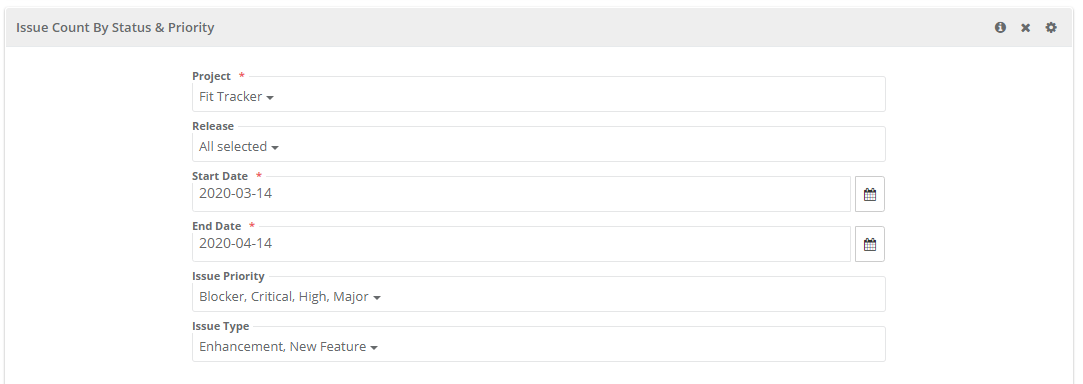
Filter Report:
Click on the Filter icon on the individual chart to generate the report as per requirement by applying multiple filters.
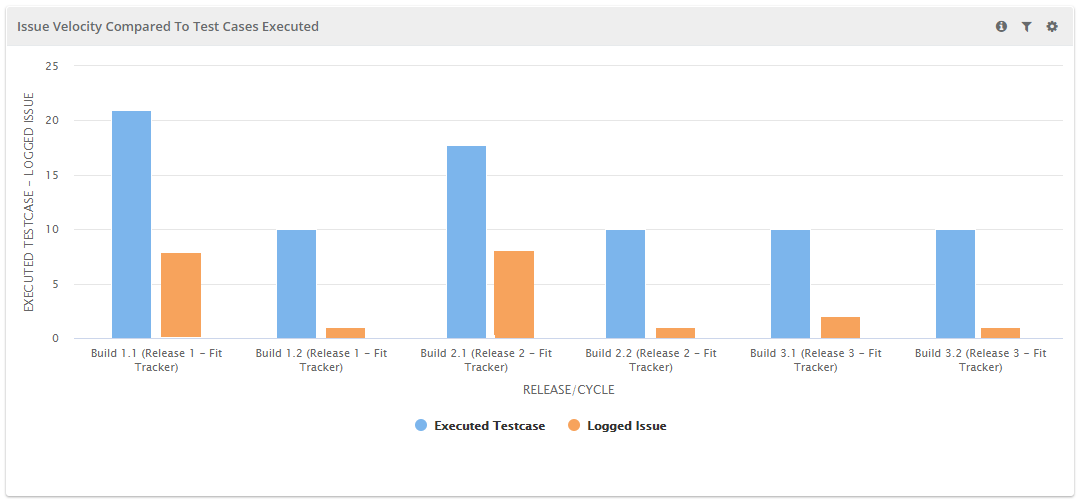
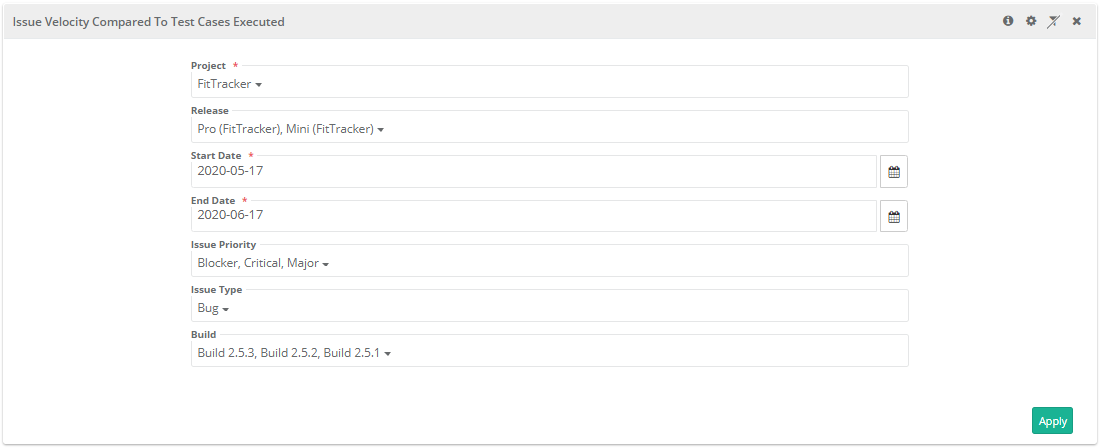
Issue Velocity compared to Test Cases executed
The report displays the velocity of logged Issues vs. Executed Test Cases during a particular Cycle. The management gets the visibility of bugs logged in proportion to the execution.
The X-axis displays Cycles of selected Release(s).
The Y-axis displays count of logged Issues and count of Executed Test Cases.
Archived records will be excluded from the report.
Users can drill down the chart to view details in tabular format.
Filter Report:
Click on the Filter icon on the individual chart to generate the report as per requirement by applying multiple filters.
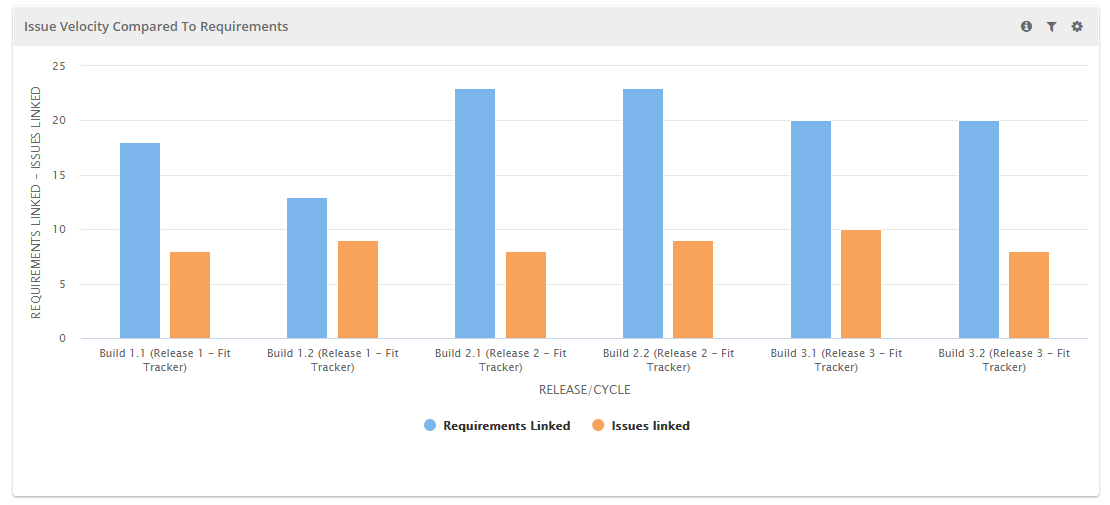
Issue Velocity compared to Requirements
The report displays the velocity of number of Issues logged during the cycles vs. number of Requirements associated to the release and cycles.The count of logged issues includes distinct count of issues logged to requirements and issues logged during test execution.
The report helps Managers make Release planning by knowing the velocity of issues vs. number of stories.
The X-axis displays Cycles of selected Release(s).
The Y-axis displays the count of Requirements and issues logged for Test cases and Requirements for selected release.
Users can drill down the chart to view details in tabular format.
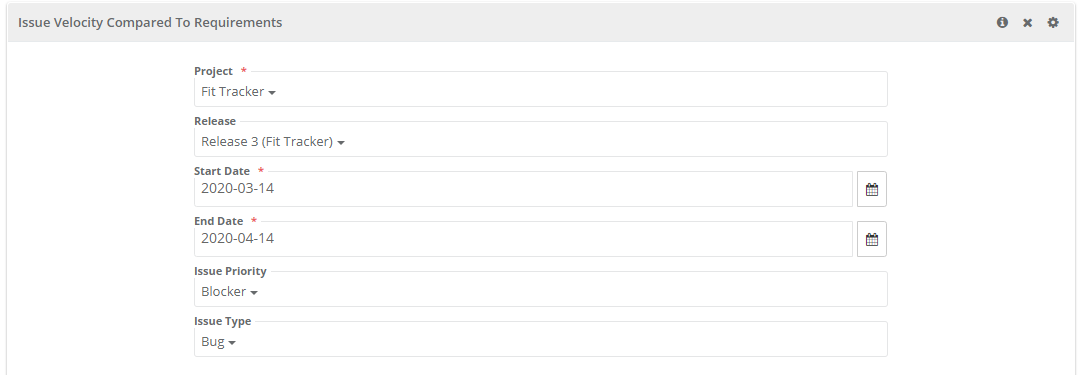
Filter Report:
Click on the Filter icon on the individual chart to generate the report as per requirement by applying multiple filters.
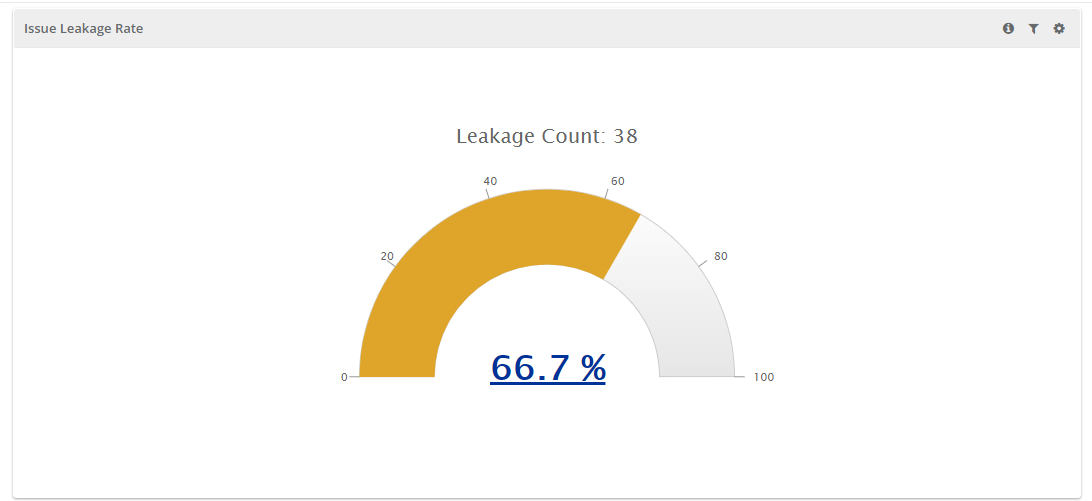
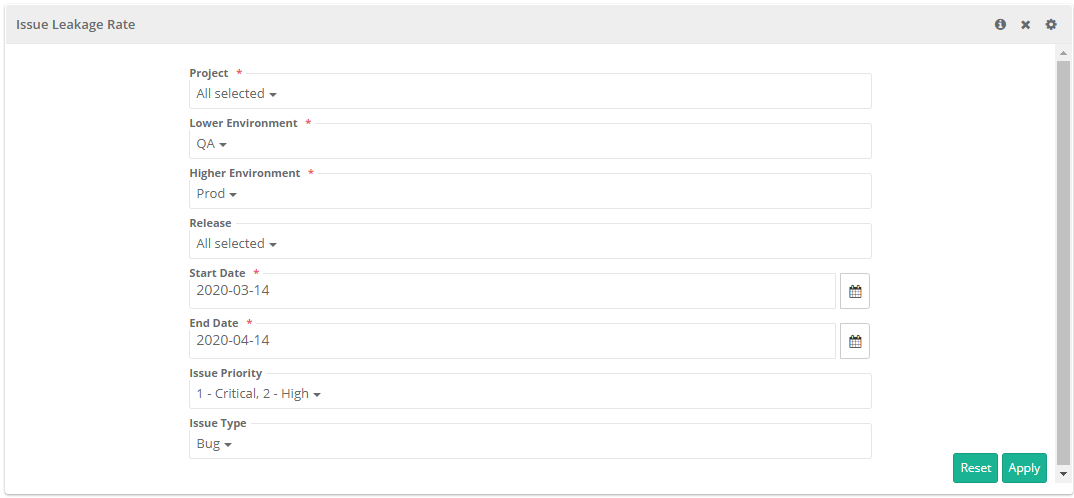
Issue Leakage Rate
The report shows Issue Leakage (in percentage) between previous environment and current environment. Bugs/Defects missed from one level of testing to next level of testing is called Issue Leakage. Issue Leakage is the presence of bugs/defects which can be detected in the earlier stage of testing. The report helps QA Manager know the defect leakage and keep check on it.
Users can drill down the chart and can find all Production Environment issues.
Issue Leakage is calculated as below:
Number of Issues found during next phase / (Number of Issues found during testing + Number of Issues found during next phase) * 100
Filter Report:
Click on the Filter icon on the individual chart to generate the report as per requirement by applying multiple filters.
Users can select environments that are in succession. The "Environment" values on the drop-downs are populated in accordance with the values entered while logging issues.
- Lower Environment: This can be referred as testing in Previous Environment. For example, build deployed on a staging environment before production.
- Higher Environment: This can be referred as testing at Current Environment which will be in sequence of previous one. For example, build deployed on production environment.
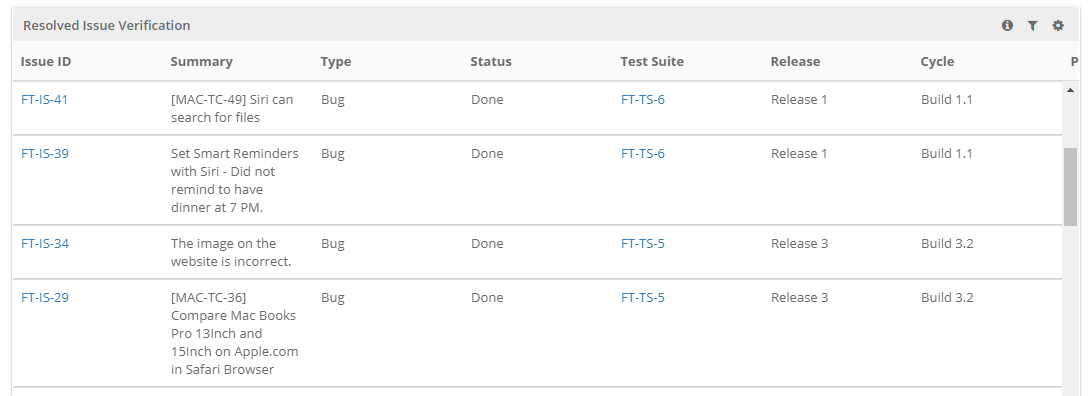
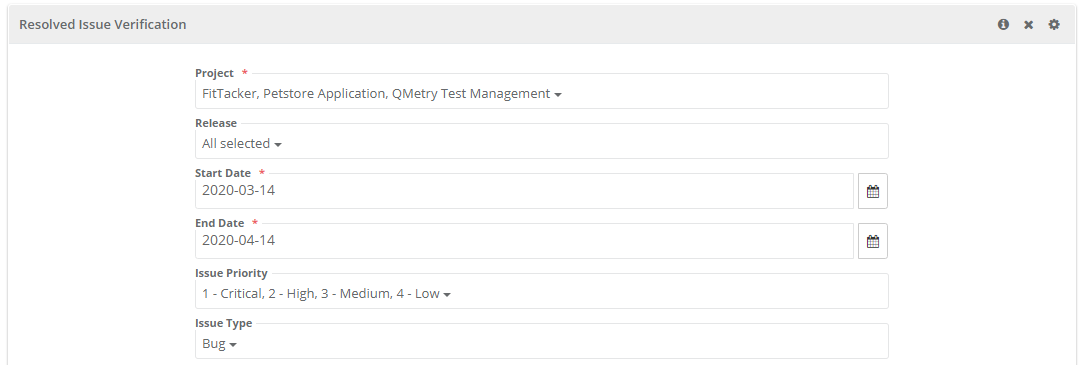
Resolved Issue Verification
Configuration related to Resolved status is provided at project level to define issue status in which issue will be considered as "Resolved". Configure Resolved status for issue from Projects > Project/Release/Cycle.
When multiple projects with different Resolved status configurations are selected to generate the report, it displays issue records for respective projects accordingly.
The report is generated on the basis of the status you selected as "Default Resolved Status".
The Resolved Issue Verification tabular report displays traceability of issues which are marked as "Resolved". Issues are displayed with their associated test suites and test cases.
The report displays linkage hierarchy for issue i.e. issue linked at test case or test case step.
Linkage level column is added in the Resolved Issue Verification report to display the linkage level of an issue. If an issue is linked at both the level, then different entries are displayed for each level.
The report also displays details of test suites and test cases associated to resolved issues.
Filter Report:
Click on the Filter icon on the individual chart to generate the report as per requirement by applying multiple filters.
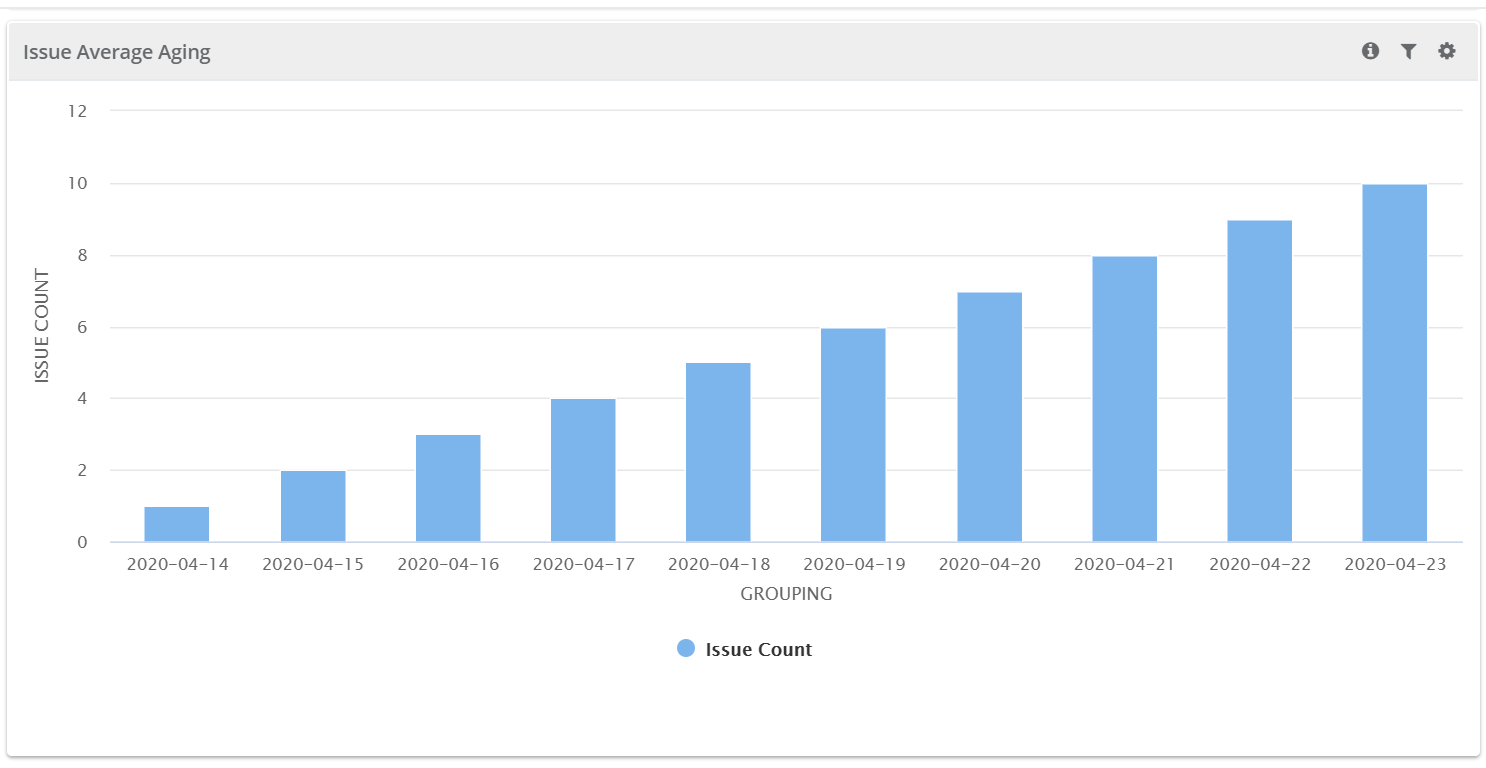
Issue Average Aging
The report is a bar chart that shows the average age of unresolved issues at a given point of time. The report is generated in accordance with the selection of Project, duration and issue filter.
The report is generated using the following formula for calculation:
Average age of unresolved issues on a particular day = Sum of Age of all unresolved issues on that particular day / Number of unresolved issues
For example,
One issue is created on 1st May and it gets resolved on 5th May - then in this case, the age of that issue is 3 days.
Another issue is created on 2nd May. Now on 4th May there are total 2 issues in Unresolved state with Sum of Unresolved Age 6 days (4 days for Issue1 + 2 days for Issue2).
The report shows the average age of issues on that particular date.
Filter Report:
Click on the Filter icon on the individual chart to generate the report as per requirement by applying multiple filters.
Back to QMetry All Products Help Page