Test Case Report
Test case report provides standard industry matrices used by QA managers & Testers to get a summarized view on test automation coverage, execution coverage, test cases affected with bug for combination of Project, Release and Cycle. The summary graphs can drill further to get the details of test cases. The fields/columns can be grouped, sorted, selected (show/hide), resized. Graphical report can be exported in PDF or PNG formats and drilled down details can be exported in Excel or CSV format.
The report can be generated for multiple projects. You can select more than one project on the drop-down.
Only one Release and Cycle can be selected at a time.
- If only Project is selected (without Release and Cycle), then the latest version of test case will be considered in the report.
- If Release/Cycle is selected along with Project, then the test case version associated to that Release and Cycle will be considered in the report.
Test case reports show the following matrices :
Manual Vs Automated : The report shows summary of Manual vs Automated test cases based on testing type. Testing type is decided based on how a test case is created in QMetry. Test cases that are created/imported (via excel) using QMetry UI will have type as "Manual". Test cases that are created through Automation will have type as "Automated".

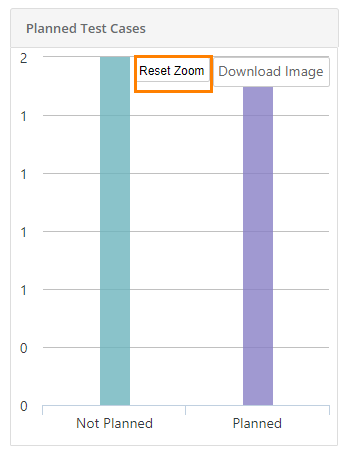
Planned Test cases : The report shows summary of test case planned or unplanned for execution. Test case those are linked with test suites are "Planned" for execution. Test case those are not linked with test suites are considered "Unplanned" for execution.

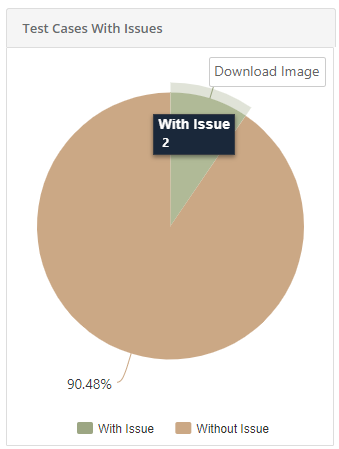
Test cases with Issues: The report shows summary of Test cases associated with issues captured during execution. The report can be filtered based on combination of Release and Cycle. The issue linked at test step level are not considered for this report.
Test case Summary by Workflow Status/Priority/Test Category : The report shows summary of test cases grouped by their workflow status/priority/test category.

Download Chart
You can see the Download Image button on hovering over the individual charts. The download functionality makes it easier for users to save charts as images with PNG format.
Click on the Download Image button and the download process starts.
Zoom in the Bar Chart
You can zoom-in the chart view by just holding and dragging the mouse pointer to select a particular area on the chart. It enlarges that covered area on the chart and let you view more granular details. It gives you a closer look of the portion you selected on the chart.
To go back to the original view, click on the Reset Zoom button on the chart.
Drill Down the Chart
You can view the tabular format for graphical representation. Drill down the chart by clicking on the required portion/bar of the chart. The columns can be rearranged on the table as per priority in the report through the drag and drop operation.
Schedule Emails to Send Reports
You can share updated reports on regular basis to stakeholders. QMetry offers the flexibility to schedule emails that will contain PDF of report details.
To schedule outbound emails at particular frequency, click on the Schedule button for the report that you want to share. The report details will be sent in PDF to recipients as per defined schedule.
The Schedule icon turns green as soon as the email is scheduled.
Scheduler History: The Scheduler History button is located adjacent to the Scheduler button. Click on the Scheduler History button to view the history of scheduled reports.