...
Click on the chart icon and select the chart type you want to view the report in.
You can view the count on hover by hovering over the chart.
...
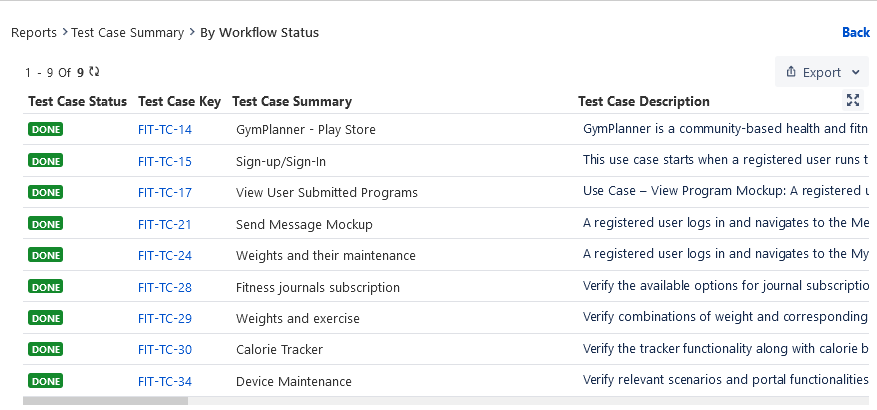
Tabular View
You can also view the report in tabular form. The tabular view provides information in rows and columns.
You can access the tabular view of the report from two places:
(A) Tabular View
(B) Bar Chart
(A) Tabular View
Click on the table icon to view the report in tabular format.
...
The count in the table is also clickable. On clicking the count it shows the records for the count.
...
(B) Bar Chart
The tabular view report is displayed at the bottom of the Pie, Bar, and Line charts for the following reports:
Test Case Reports
Test Execution Reports
Defects Reports
Traceability Reports
Coverage Reports
...
The links on the count are clickable which navigates you to the list of relevant records. You can further Export the records.
...
Drill Down Reports
→ For a graphical view, you can drill down the chart by clicking on the required portion/bar of the chart. You can view the tabular format of the graphical chart.
...