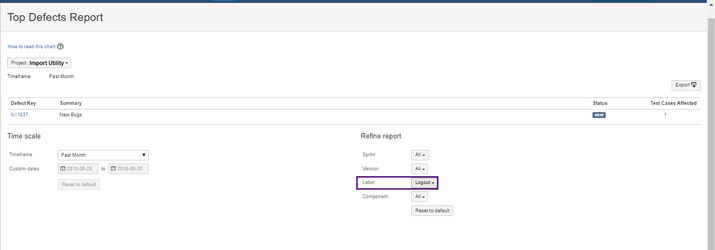
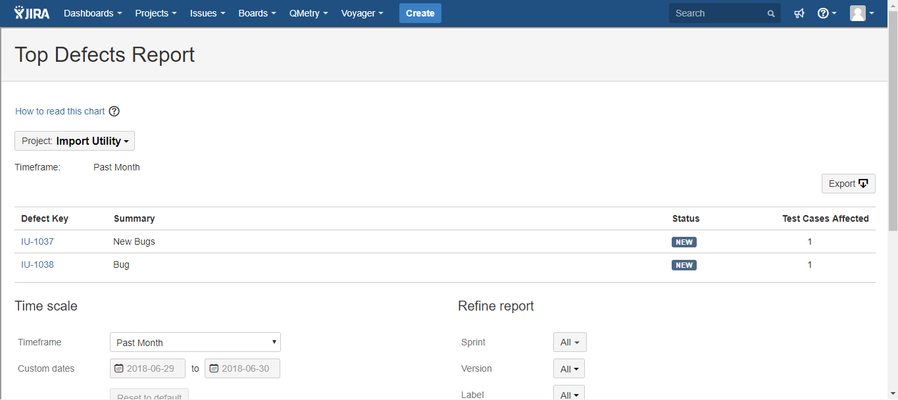
The report shows the top defects affecting the most test scenarios created over a period of time, Sprint or Version for a project. You can refine the chart by sprint, version, component and label.

A. Time Scale
You can generate the report for different time scale:
(a) Time frame
Time frame | The report is generated on calculation of the data that existed during – |
|---|---|
| Past Week | past week from the current date |
| Past 2 Weeks | past two weeks from the current date |
| Past Month | past month from the current date |
| Past 3 Months | past three months from the current date |
| Past 6 Months | past six months from the current date |
- Custom: Use the calendar to select “From” and “To” dates to define the time to consider the data. The "Custom Dates" is enabled as soon as you select the Custom Time frame.
...
- Sprint
- Version
- Label
- Component