...
- Create a filter (using Jira's advanced search) that will list your desired Test Runs. For example filter by Sprint.
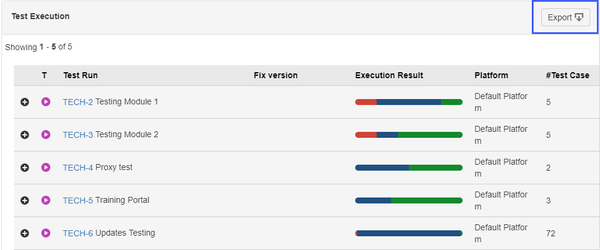
- Add Test Run Summary Gadget to your dashboard.
- Select above created filter for the report.
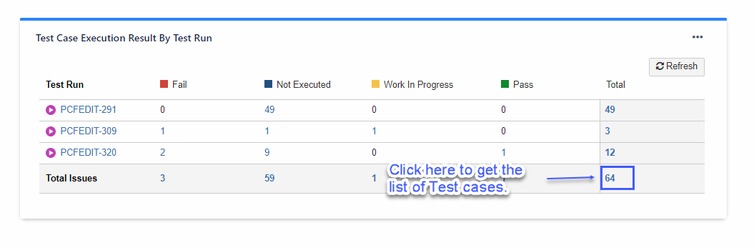
- The report will now show the statistics for filtered Test Runs.
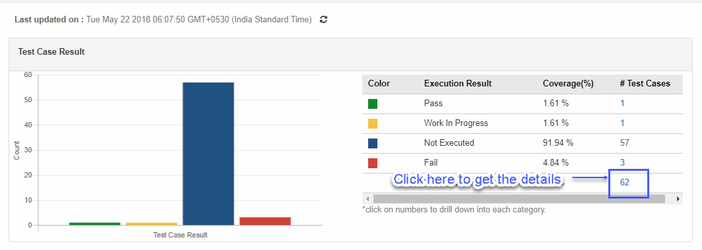
- Click on the Total number of Test cases to see the data in more detailed view. Refer screenshot.

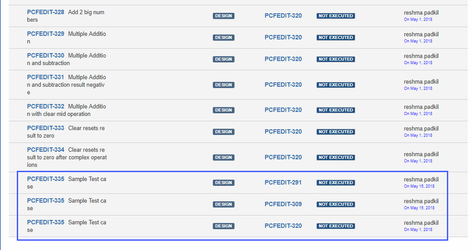
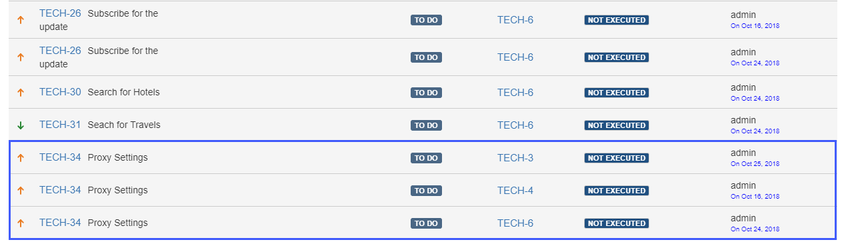
- Since the detail view shows the data according to ascending order of Test case internal id it will be easy to view the Test cases those are linked on multiple Test Runs. Refer below screenshot.
- Here is the help article on how to use Test Run Summary Gadget.
...
- Go to QMetry Menu > View Reports > Test Run Summary report.
- Modify Test Run scope.
- Apply filter to select your desired Test Runs. (You can filter by sprint).
- Select the Test Runs and the report will show the statistics for selected Test Runs.
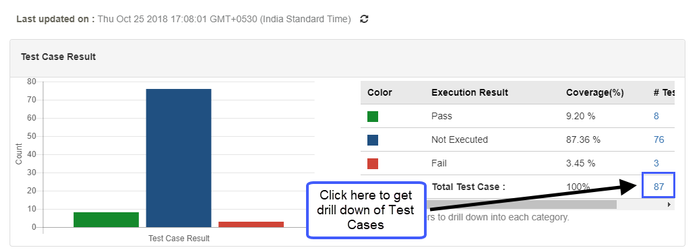
- Click on the Total number of Test cases to see the data in more detailed view. Refer screenshot.
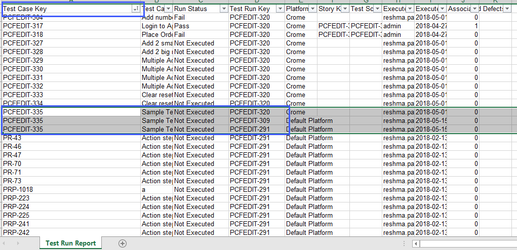
- Export this data is in excel. Refer screenshot
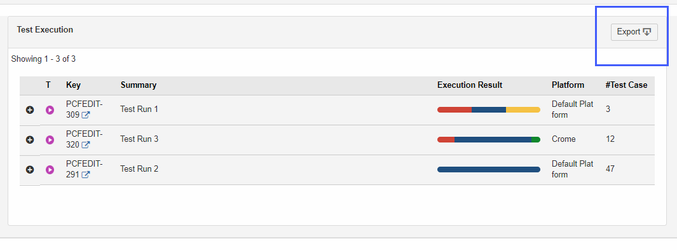
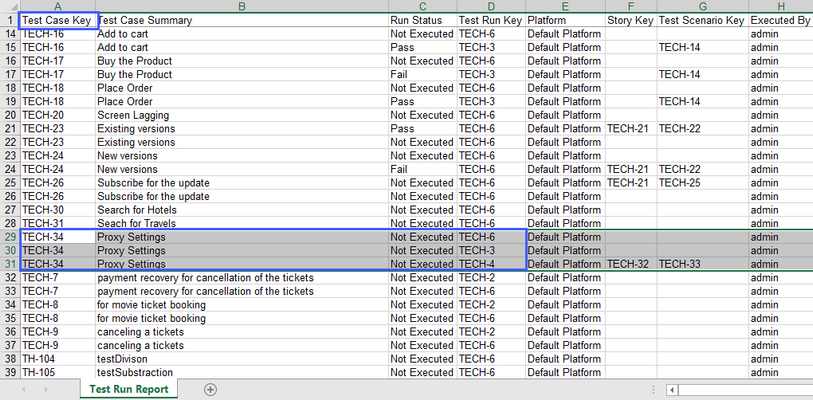
- The Excel will have the columns like Test Cases, Test Runs etc. You can view the Test cases linked on multiple Test Runs by grouping the Test cases as shown in screenshot.
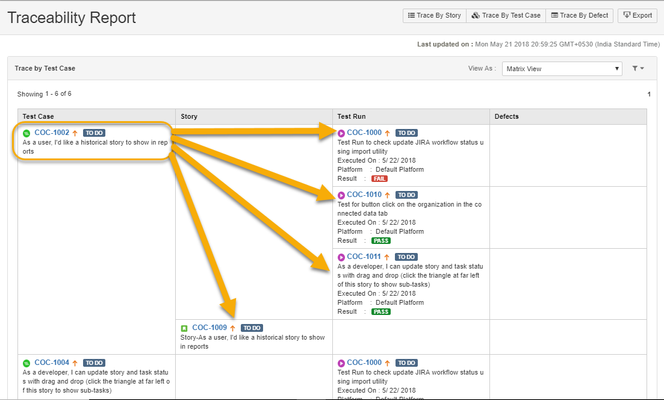
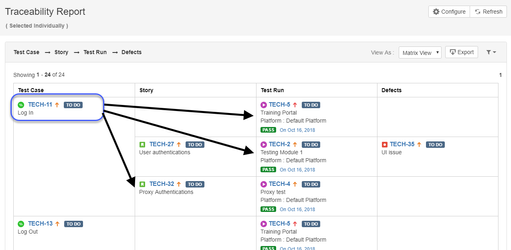
Traceability report
...
In this report we can see the 'Story' and 'Test Run' columns and it displays the Stories and Test Runs in which the respective Test Case has been reused. Please refer below screenshot.