| Table of Contents | ||
|---|---|---|
|
...
In QMetry Insight, you can see the list of tables and their fields on the left panel. The panel contains the consolidated QMetry data in just 15 tables which are synced in real-time. For making the query creation easier, the names of the tables have resemblance with QMetry test assets and different modules.
Note: In Requirements and Issues tables, field names having "Jira" as prefix are renamed with “Ext” prefix. For more details refer this page.
...
By default, it gives you output in tabular format. You can modify the output format by switching to the available chart types from the table. In our case, we will switch it to the Bar Chart.

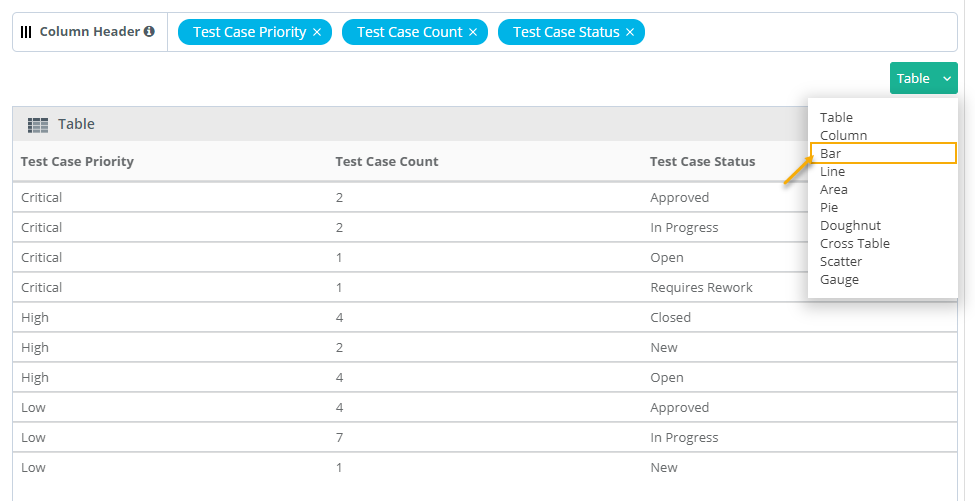
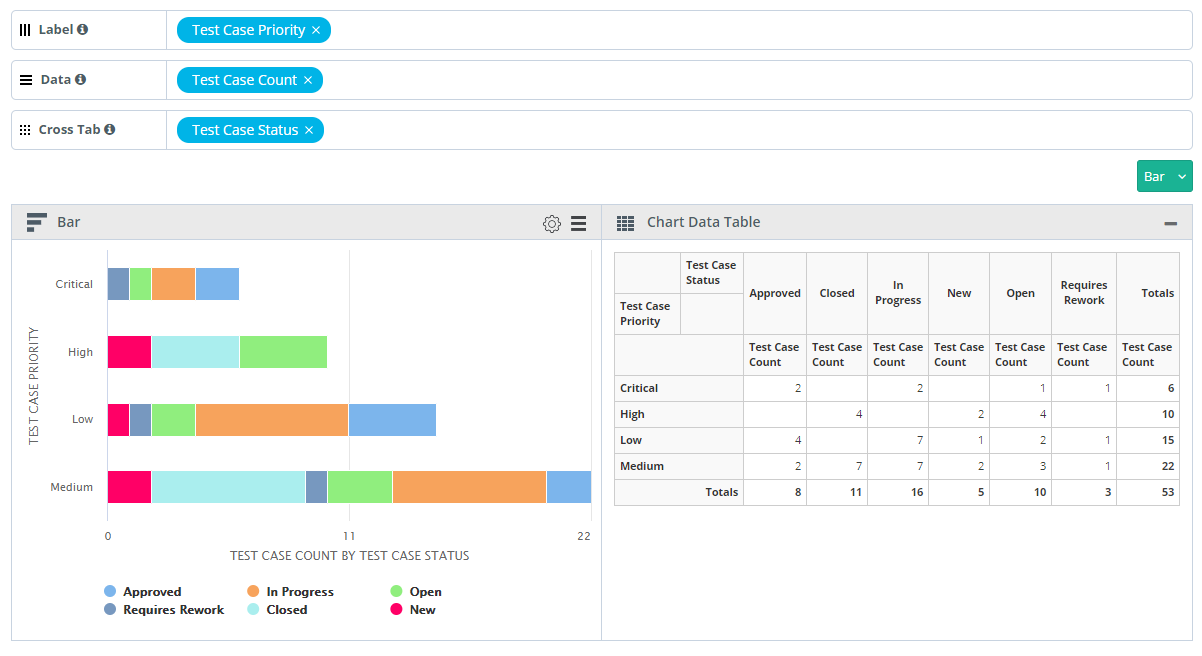
You can adjust the Columns based on the requirement to Label, Data and Cross Tab sections.
Label always holds a single Test entity field with any value.
Multiple Test entity field on Data creates a stacked chart; Data always contain fields with numeric values.
Cross Tab field will help to create a Group Stacked chart.

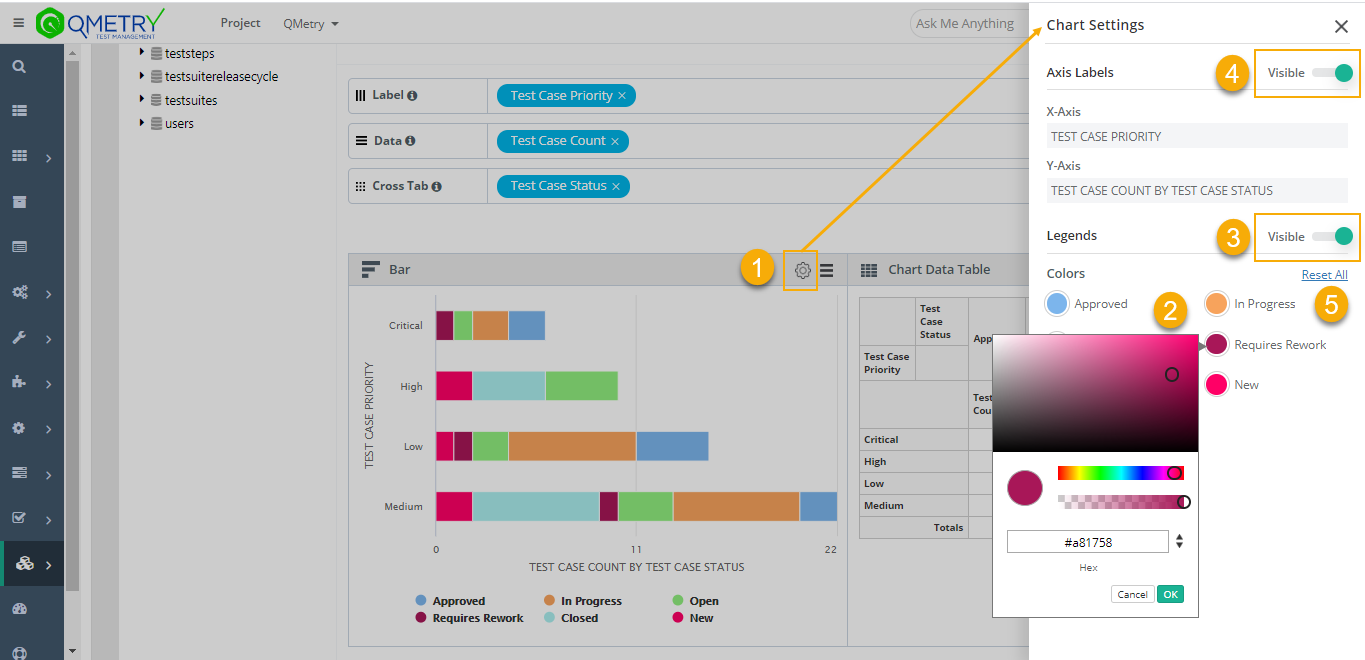
Step 2 : Modify Chart Colors
...
Click on the cog icon on the graph. It opens the Chart Settings panel.
You can customize the color of the legends as per your requirement.
You can show/hide the legends on the graph by enabling/disabling the Visible settings.
You can also show/hide the axis labels on the legends by enabling/disabling the Visible settings.
Click on the “Reset All” option under the Colors section to revert the changes (it will reset the colors to system-defined colors).

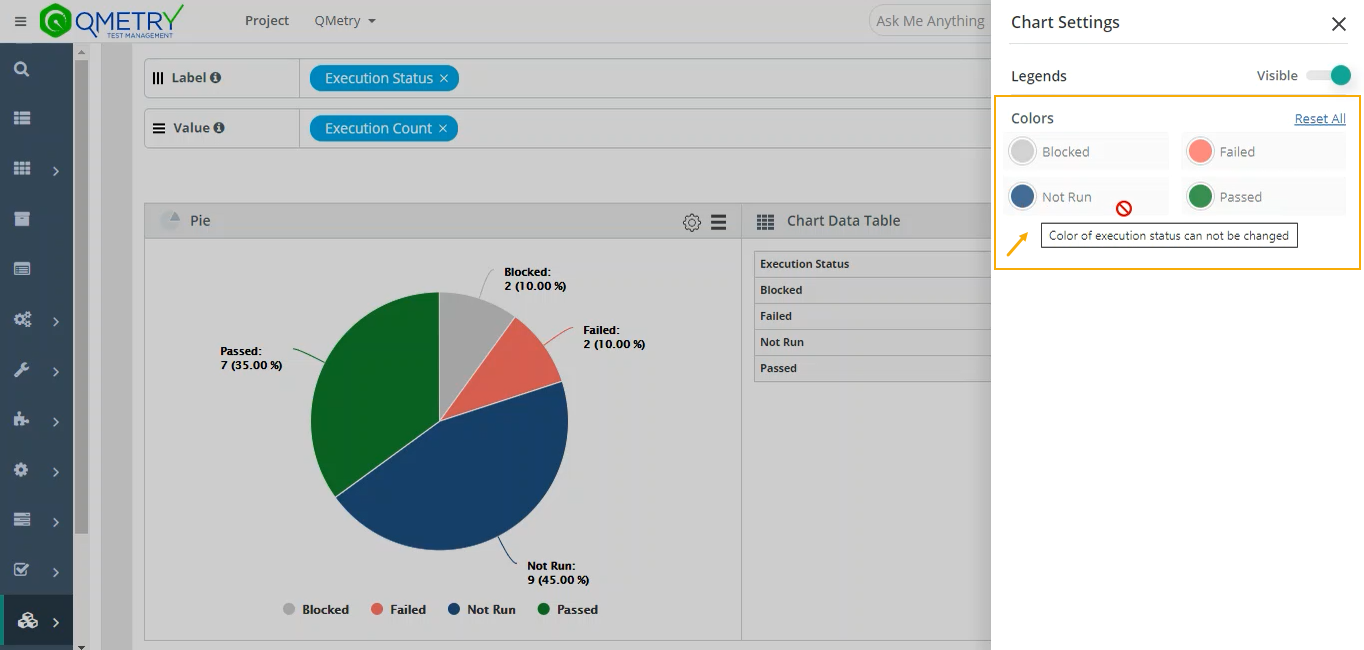
Note: Colors of Execution Status used as legends appear as they set under Customization > Execution Status. You can not modify the colors from chart settings as the option remains grayed out for execution status (refer to the attached screenshot).

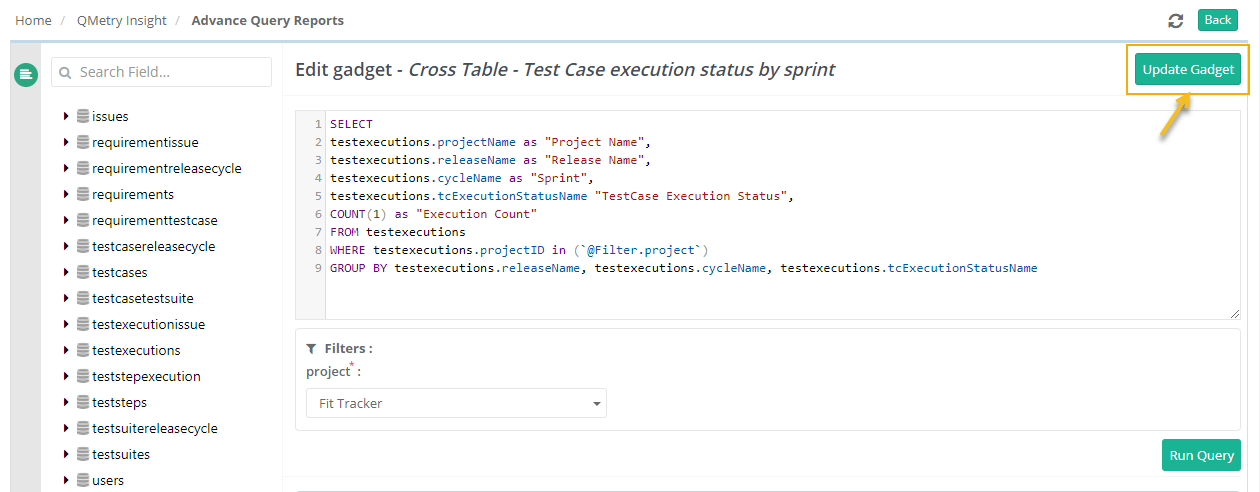
Edit Gadgets
The gadgets created under Advance Query Reports can be edited from the QMetry Custom Gadget.
...
2. Click on the Edit icon for the gadget that you want to edit. It navigates you to the Advance Query Reports (SQL query builder view) of the QMetry Insight module.

Exporting Gadget Data
...
You can also export all the custom dashboard gadgets through the API call. Refer to the link - API for Reports for more details.
Best Practices
- Rights to write custom queries must be provided only to those users who have knowledge of writing SQL queries and can access any QMetry data, as there is direct access to all QMetry data in Report Schema DB.
- The custom SQL queries must always include a project filter specified as : @FILTER.PROJECT. This will prevent the recipients of the shared report gadgets from inadvertently viewing data from other projects that they do not have access to.
- The custom SQL report queries after creation must be run and saved against a Sample Project, so that the report does not load with the data of an un-intended project.
- The Report DB has tables like testcase, testexecutions, etc. which now only have user IDs instead of the actual information of the users. This information should be queried by writing an SQL Join with user IDs from `users` table now available in the Report DB schema.