...
Log into QMetry for Jira, go to Dashboard and open a your dashboard.
...
Click on the Add Gadget button at top right. A screen pops up with the list of available gadgets.
Select QMetry ChartsReports to add on the dashboard by clicking on the corresponding Add gadget button.
Then click Close to close the screenClose ‘Add a gadget’ window.
...
QMetry Charts Reports block is added to the Dashboard.
...
You have to utilize the filters you saved while configuring the Reports (Configure and Generate Report). To generate and view the Charts, select and apply one of the saved filters.
1. Open More icon for the chart and select Edit.
...
The next screen Once the gadget is added it will displays Saved Filter drop-down. As mentioned above, the filters saved while generating reports are then displayed on the Saved Filter drop-down of dashboard. Refer to Configure and Generate Report for more details.
...
2. Select the Filter you want to generate the chart thereof.3. Click report thereof and click Save.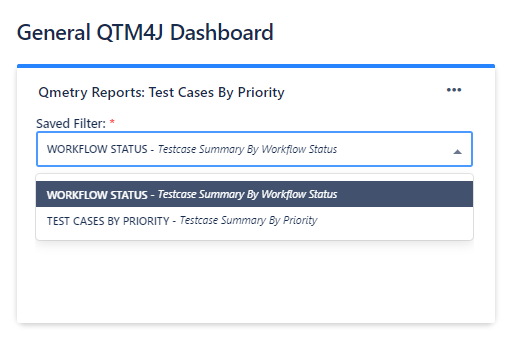
...
The Chart is generated and displayed. Hover over the chart sections to see the corresponding count.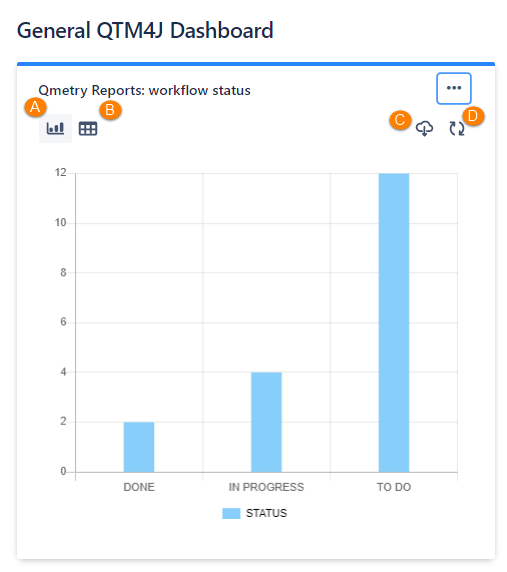
...
The icons available on the chart are described below.
...
The following more options are available for individual charts:
Maximize
Minimize
Delete Chart
Rename Chart
...
Edit : User can update the filter being used for the gadget.
...
Share QMetry Gadgets
User can share Jira's dashboard so that QMetry Gadgets can also be shared. It helps in keeping the whole team on the same page.
...