Enable logging in QMetry
Go to QMetry → Configuration → Under Advance Settings: Go to "Logging".
Set the "Enable/Disable Logging" option to
: Enable“Enable”.
How to set log levels in JIRA
Navigate
to Settingto Setting ->System ->
Logging and Profiling tabEnable SQLLogging and Profiling tab
Enable SQL Loggings for SQL log & SQL dump logs
Scroll the same page below to go
toto the Default Loggers
section click on Configure linksection click on Configure link
Enter Package name
as “comas “com.atlassian.
qtm” andqtm” and Logging level as
“Trace”“Debug”. Click
on Addon Add.
- In Default Loggers search
In Default Loggers search for the
following Package Name andfollowing Package Name and click on
“Trace”“Trace” for the below 3 packages:
net.java.ao.sql
net.java.ao.schema.SchemaGenerator
Then, go to QMetry → Configuration → Advance Setting: Logging. Set to "Enable"
Once these settings are changed, reproduce the issue on your JIRA instance, so that traces are logged.
How to access JIRA Server Logs
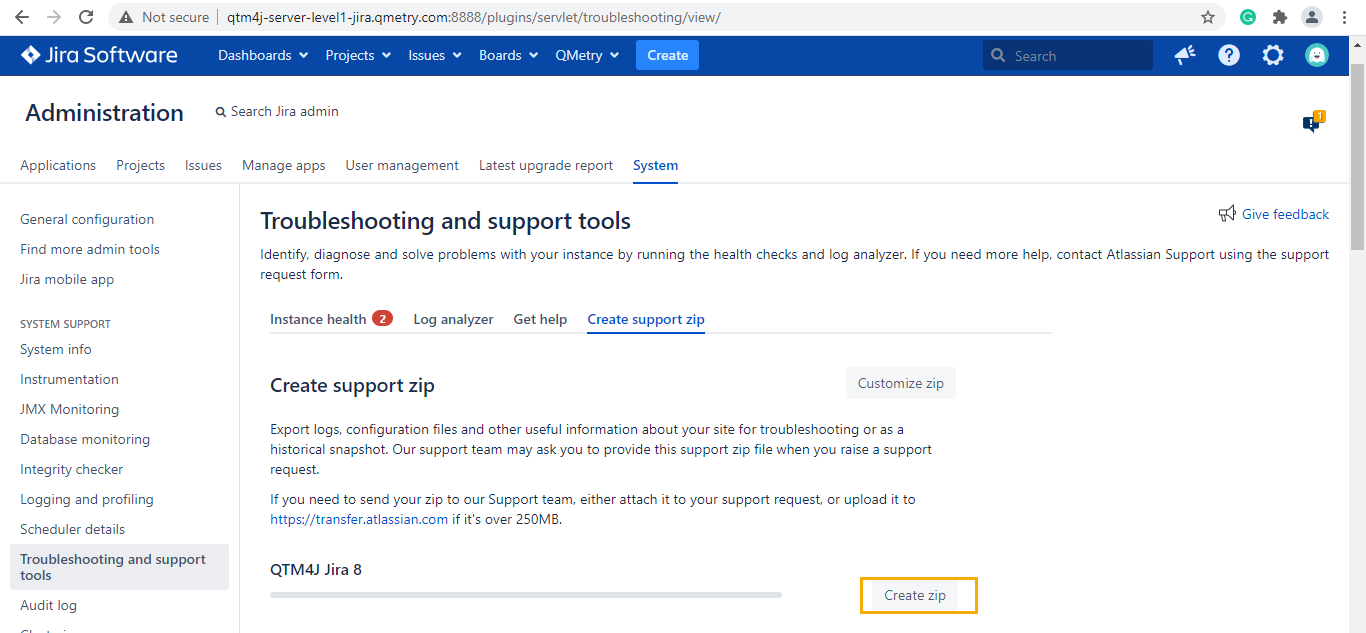
Navigate to Setting ->System -> Troubleshooting and Support Tools tab
Go to the create support zip tab
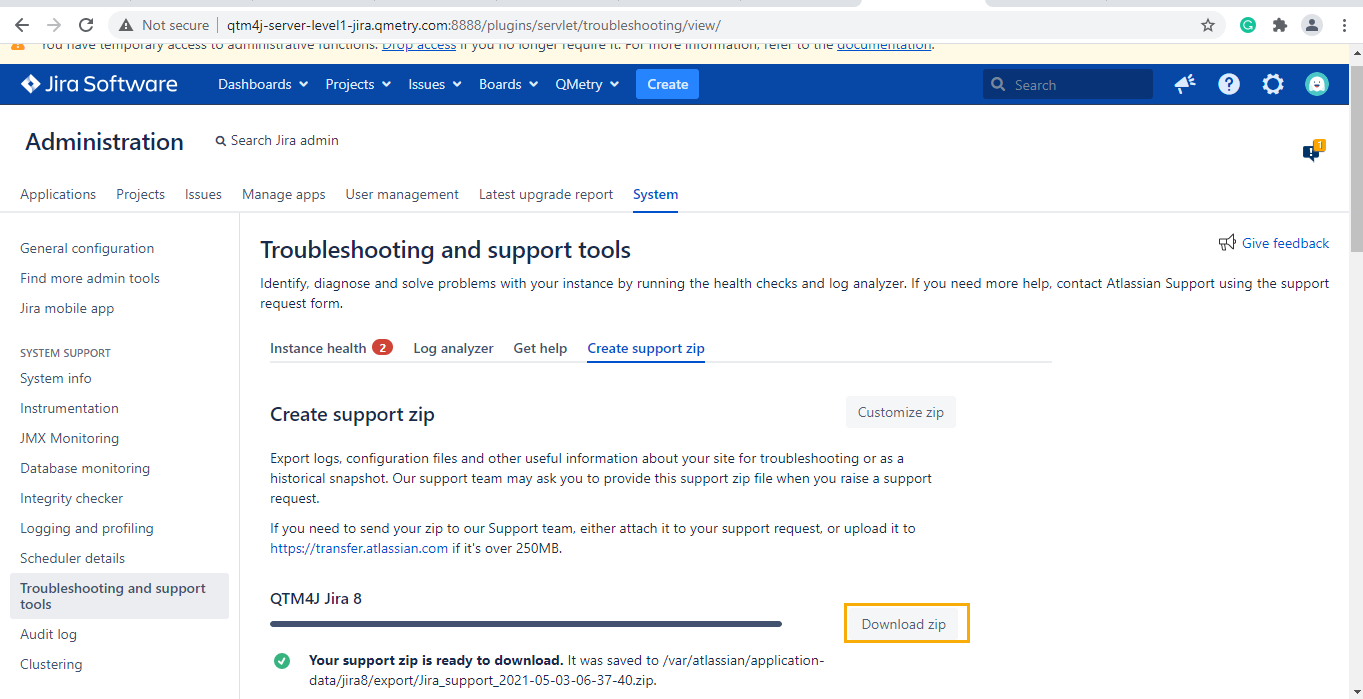
For Server: Click on the create zip button and download the logs as shown in the below screenshot:
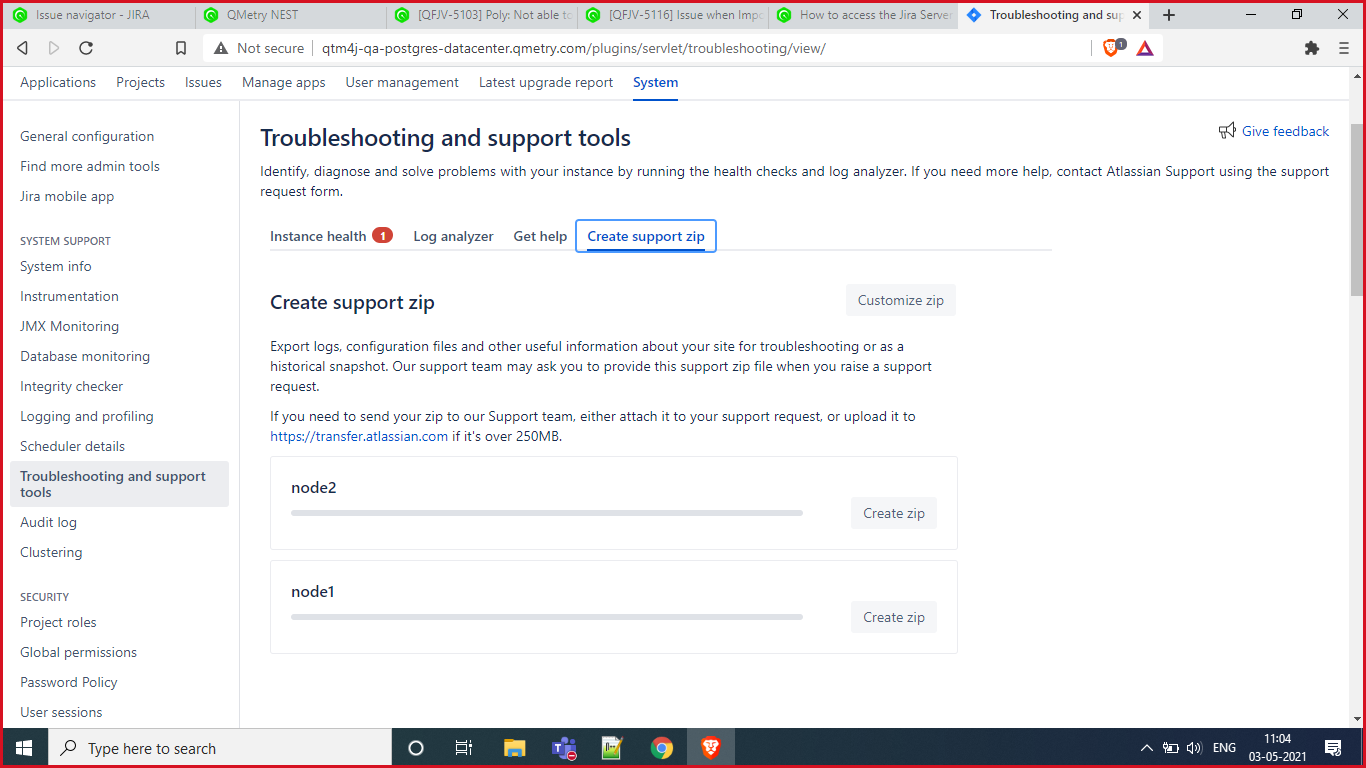
For Datacenter: Click on the create zip button for all the nodes and download the logs as shown in the below screenshot:
Alternatively, you can opt for the below option:
Go to the directory where you have installed JIRA on your server. Fetch the JIRA logs &
share atlassianshare atlassian-jira.
log and Catalina log fileslog and Catalina log files with QMetry Support.
For UNIX server: If the directory name is JIRA. You can access logs at JIRA/logs/catalina.out and JIRA/home/log/atlassian-jira.log. In case you do not find the files, trigger the below commands in the UNIX terminal which would fetch the list of logs files path.
find / -name "atlassian-jira.log" 2>/dev/null
find / -name "catalina.out" 2>/dev/null
For Windows server : You can access logs from C:\Program Files\Atlassian\JIRA\logs\catalina<Date>.log and C:\Program Files\Atlassian\Application Data\JIRA\log\atlassian-jira.log
How to reset the log levels in JIRA
Once the logs are provided and the issue is resolved, go
the Default Loggers searchthe Default Loggers search for the following package and click on
“Debug”“Debug” for all three of them.
net.java.ao.sql
net.java.ao.schema.SchemaGenerator
Go to QMetry → Configuration → Advance Setting : Logging. Set to "Disable". NOTE: The Enabled setting generates more verbose logging. If this is not reverted to "Disabled", it can affect performance and quickly fill up JIRA server logs directory.
Disable logging in QMetry
Go to QMetry → Configuration → Under Advance Settings: Go to "Logging".
Set the "Enable/Disable Logging" option to
:Disable