...
You can also view the report in tabular form. The tabular view provides information in rows and columns.
You can access the tabular view of the report from two places:
(A) Tabular View
(B) Bar Chart
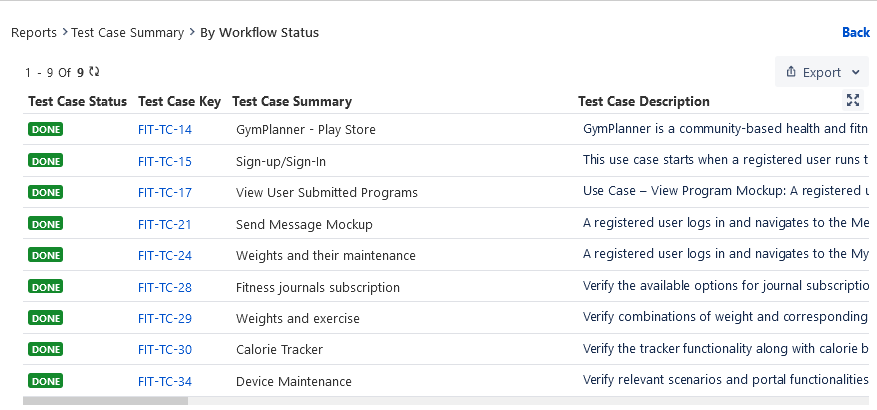
(A) Tabular View
Click on the table icon to view the report in tabular format.
The count in the table are is also clickable. On clicking the count it shows the records for the count.
...
(B) Bar Chart
The tabular view report is displayed at the bottom of the Pie, Bar, and Line charts for the following reports:
Test Case Reports
Test Execution Reports
Defects Reports
Traceability Reports
Coverage Reports
...
The links on the count .
...
 are clickable which navigates you to the list of relevant records.
You can further Export the records.
...
Drill Down Reports
→ For a graphical view, you can drill down the chart by clicking on the required portion/bar of the chart. You can view the tabular format of the graphical chart.
...
The asset keys in the drilled-down report are clickable, which opens the asset detail page.
...
Reports can be exported using the following options:
With steps: The exported report contains all Test Steps for all Test Cases in the selected Test Cycle.
Without steps: The exported report contains only the list of Test Cases in the selected Test Cycle.
...
If the records in the report that is are being exported exceeds exceed the limit of 1000, then this report will not get downloaded but will be emailed to the registered email address.
...