| Table of Contents |
|---|
| Note |
|---|
On integration of Jira with QMetry, the Issues module of QMetry will not be available. |
Issues Module UI
The Issues module screen has the following UI.
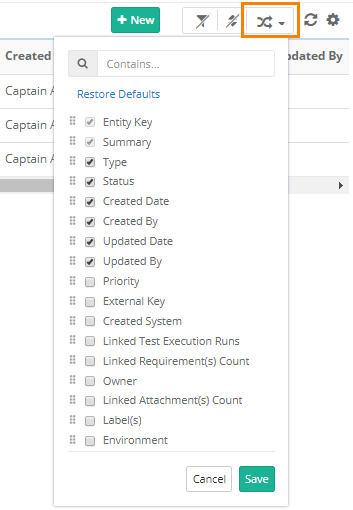
Manage Grid Columns
All grids within Requirements, Test Cases, Test Suites, and Issues module have Arrange Columns option that allows users to create a customized view of their test assets.
The view is saved for future use.
The following customization can be applied:
- Show More Columns: The ability to add columns in view. If there are other columns that you think important to display on the module grid apart from the default view, then you can just select those columns to add them to the view.
- Hide Columns: The ability to remove a column from view. If you do not want to include columns of less important on the module grid view, then remove column selection to hide those columns on the view.
- Re-arrange: The ability to arrange the columns in a different order through drag and drop functionality.
You can search for a particular column through the search box.
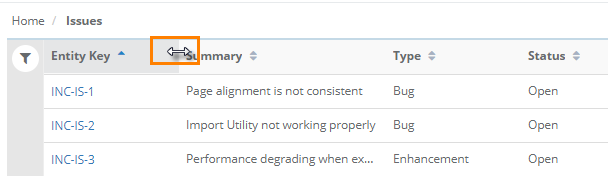
- Resize Columns: The ability to expand and reduce column width. If you want to display the full content of the column, then you may want to change the column width. To change the width of one column, just place cursor in between the columns and drag the boundary on the right side of the column heading until the column gains the width that you want.
Issue Detail Page
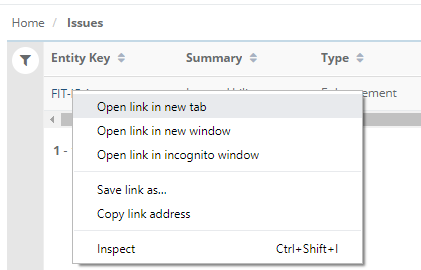
Just click on the Issue Key in the grid view to open the issue detail page on the same page.
To open the issue detail page in new tab/window, right click on the Issue Key in grid view. Opening issues in different tab/browser makes comparison between issues easier. It also provides quick reference while working on multiple assets.
The detail page is redesigned that allows one click access to different sections using organizable tabs.
Organize Tabs
The detail page of QMetry assets has different tabs on it as described above. Users can customize the view of detail page by changing the order of tabs. The tab order is preserved per user.
For example, the tab order of Issues module is changed by user "A" for project "PRO1". Now "A" is switching to another project "PRO2". The tabs can be seen in the same order as in project "PRO1".
Combined View vs. Grouped View
A. Individual Section Tabs
B. Combined View (Read Only View)
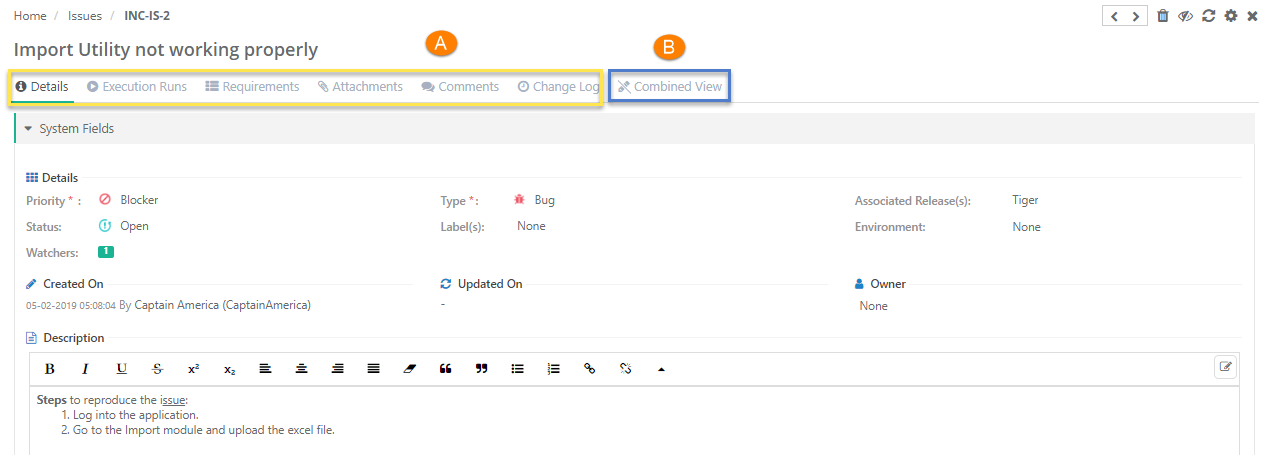
A. Individual Section Tabs
For Issue: There are individual tabs for Details, Execution Runs, Requirements, Attachments, Comments, Change Log.
Each tab displays relevant details. The details are editable.
B. Combined View (Read Only View)
The tab renders the old view of details page. You can view the details of all the section on a single page. The details displayed on the page are read-only and it can not be edited.
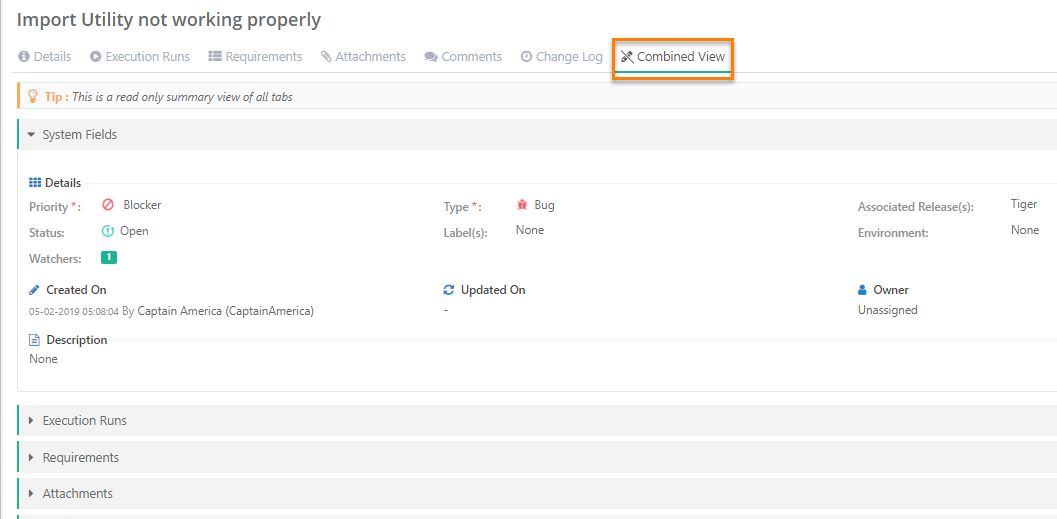
The Previous and Next buttons on the detail page are added for ease of navigation and updation of issues.
Filter Issues
Users can easily filter test assets by any system/custom fields on all module grids. It also helps users in carrying out bulk operations. Filters placed horizontally above the grid earlier, are now placed on the tree panel at left.
Apply Filter
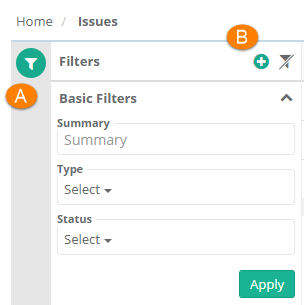
Users can apply basic as well as advanced filters to the records.
A. Basic Filters: By default, basic filter fields are provided to filter the records.
B. Advanced Filters: If users need more fields to filter test assets then click on the '+' icon. It opens the drop-down with a list of additional system and user defined fields corresponding the module.
Select the field you want to apply filter on. The filter parameter is added as Advanced Filters. Apply filter as per your requirement.
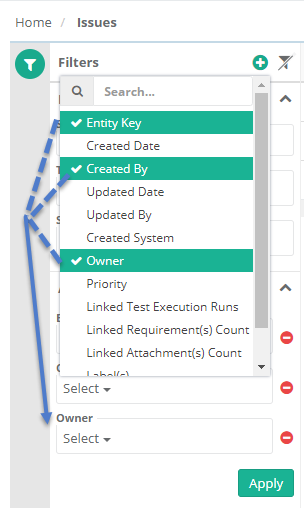
For example,
Users want to filter test assets on Entity Key, Created By and Owner, then click on the '+' icon and select the fields on the drop-down list as shown below.
Clear Filter and Sorting
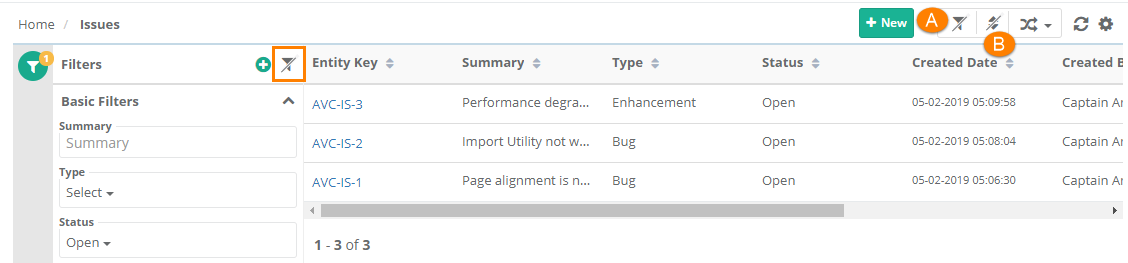
Users can clear the applied filter and sorting to the records.
A. Clear Filter: Click on the Clear Filters button above the module grid or left pane. It will reset the view to default.
B. Clear Sorting: Click on the Clear Sorting button above the module grid.
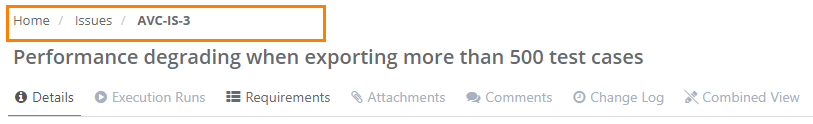
Navigation
Once you are on the issue details page, you can go back to the main screen of issues by clicking on the breadcrumbs.
Test cases are added at the Project level. The Issues module main screen displays issues in the Project as per folder selection. You can apply filter to the columns as mentioned above. Multiple columns can be filtered at once to help users find the required issues.
Add Issues / Defects
Once Jira is configured with QMetry project, then users can add issues only in Jira through the Execution screen of QMetry. Issue module of QMetry will not be visible. If Jira configuration is removed for the project, then Jira issues linked as bug will be converted as QMetry's internal issues.
QMetry has internal tracker configured by default in the absence of an Jira. Users can add issues in internal tracker when they do not have Jira configured with QMetry.
The issue details to enter depends on whether you are adding issues in internal tracker of QMetry or in Jira.
- If you do not have Jira configured with the project you are currently working on, then enter details in QMetry fields.
- If you have configured Jira with the project you are currently working on, then the add issue screen contains Jira issue fields that you need to enter. You will add defects from the Execution screen of QMetry.
Steps to log issue from Issue Module
1. Open the Issue module.
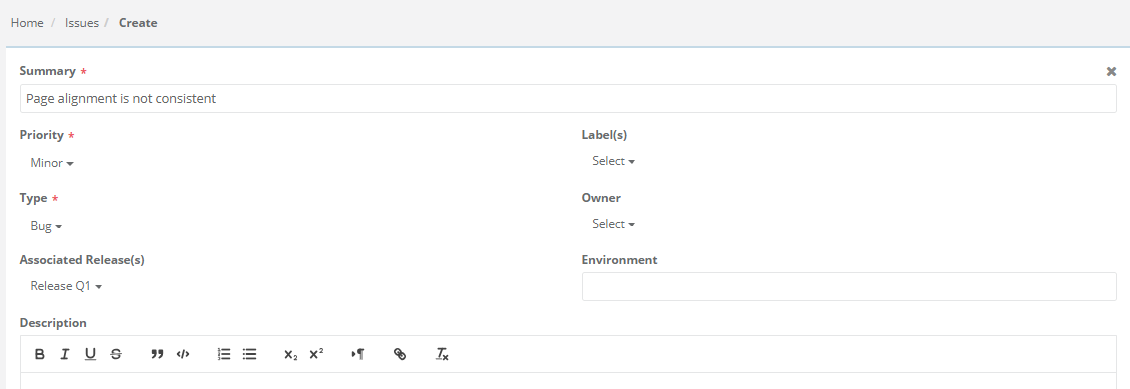
2. Click on the New button on the toolbar.
3. The Create Issues screen opens next.
4. Fill the issue details.
- Description: Enter description for the issue. Description can be added either in Plain Text or Rich Text.
A. Use of Rich Text Editor allows users to apply text formatting for Description and reduces chances of missing important details.
B. Users can paste the html/xml content into the Source editor of the "Large Text" field type and it auto-renders the code to show the text outputs on the screen.
Use Case: An organization is using Rich text for Description field, in which they copy-paste the content from their source in html/xml format.
Click on the Edit icon at right to open the source editor.
Note: To enable rich text editor, the Enable Rich Text parameter should be enabled for the Project (Projects > Project / Release / Cycle). Refer to Enable Rich Text Editor for more details.
- User Defined Fields: If UDFs are added for the Issues module, then they are displayed on the Create Issue and Issue Details screen.
Enable Rich Text and Source Code Editor: Refer to the Description field above.
Steps to log issue from Execution screen of Test Suites Module
Open the Execution screen and click on the bug icon for test case/test step. Refer to Adding/Linking Issues to Test Case and Test Step for more details.
Status:
Once the issues is added, open the Issue details page. You can see the Status field with either QMetry status filled up in it. You can change the Status value on the Issue screen.
Select the work flow status of the issue. The Status field is a System Field that you can see under Administration > Manage Fields. The list values for the field can be edited/updated from Administration > Lists. The Status field is added to track the issue workflow and its progress.
Once the Issue is added, you can see the following tabs:
- Details
- Execution Runs
- Requirements
- Attachments
- Comments
- Change Log
- Combined View
Link Requirements to Issue
You can link requirements with their relevant issues. You can link single as well as multiple requirements with an issue.
Requirements can be linked to issue through the Requirements tab of Issue.
Steps
1. Open the Issue details page.
2. Open the Requirements tab.
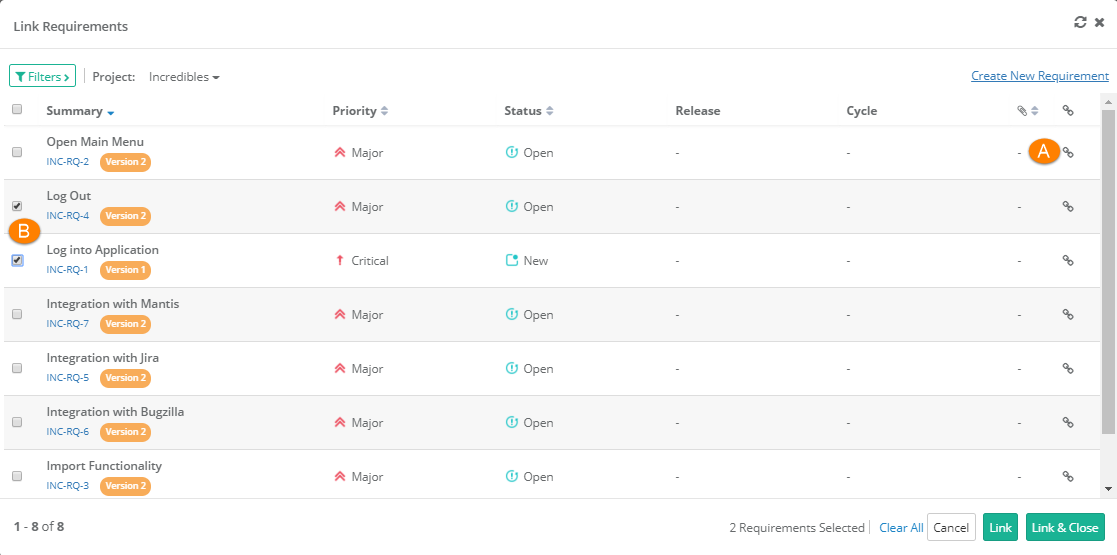
3. Click on the Link button.
4. It opens the screen with requirements.
You can select requirements on the grid to link to issue. You can filter requirement records to narrow down the list to select from. Labels and Folder path filters are also added for the ease of searching the records.
- Project: You can link requirements from across projects. Select the Project the requirements of which you want to link with the issue. You can link requirements from multiple projects.
If you want to link requirements from multiple projects, then first select one project. Search records and link them before moving to other projects. For example, User A is in Project 1 and searches for some records and link them before moving to Project 2. Else, all the selection of Project 1 will be wiped off.
A. Linking a Single Requirement: Click on the  icon to link the individual requirement to the test case.
B. Linking Multiple Requirements: Select requirements that you want to link and click either on the Link button or Link & Close button at the bottom.
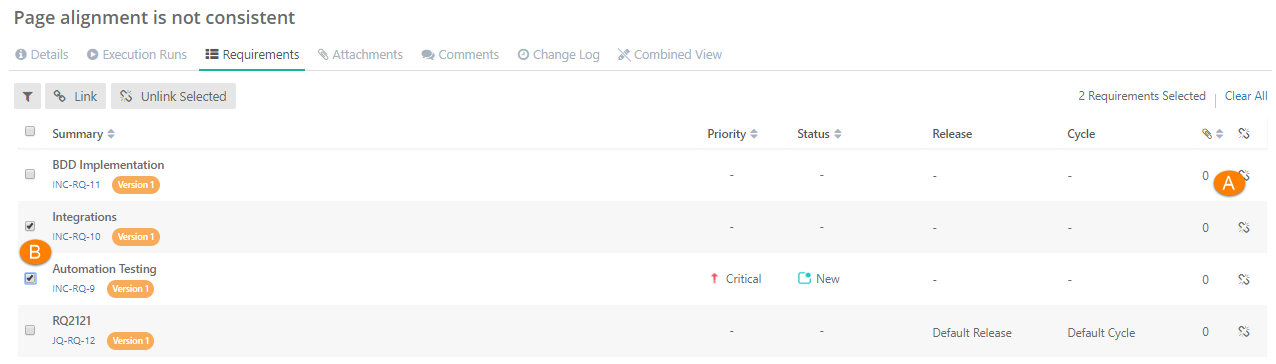
The selected requirements are linked to the issue. The linked requirement records are shown on the screen.
If requirements from other project are linked, then the requirements show Entity Key of the corresponding project.
To view the requirement of other project, click on the Requirement Entity Key. It opens the test case detail page in the respective project and will change your current project.
Unlink Requirements
Go to the Requirements tab of the issue.
A. To unlink a single requirement, click on the Unlink icon for the requirement. The requirement is unlinked after confirmation.
B. To unlink multiple requirements, select requirements you want to unlink from the issue and click on the Unlink Selected button.
Attachments
Refer to Managing Attachments for details.
Execution Runs
Issues logged from Test Executions module are displayed here.
Execution Time and Remaining Time
Open the issue detail page and open the Execution Runs tab. Users can view Execution Time and Remaining Time calculated for Test Execution.
Use Case: Calculation of Execution Time and Remaining Time for test suite is useful for QA Manager in Test Planning as it gives accurate estimates for the test suite. These test case level estimates refine each time a test suite is executed. Testers can make recommendations to have the test estimates revised based on the last few executions in different environments.
Two columns Execution Time and Remaining Time are added on the grid at the following places in the application:
- Test Suite detail page > Test Executions tab
- Test Case detail page > Test Executions tab
- Issue detail page > Execution Runs
Calculation of Execution Time of a test suite:
Execution Time of a test suite is calculated based on Estimate Time of all the test cases in that test suite.
Calculation of Remaining Time of a test suite:
Once the test suite is executed, the Remaining Time Is calculated of all “Not Run” test cases. Any test case with “Failed” or “Blocked” status will also be considered as the work still remains on it.
The Remaining Time will be reduced for test cases with “Pass” and “Not Applicable” status accordingly.
Example
The following example shows calculation of both – Execution Time and Remaining Time.
...
Execution time
...
Status
...
Remaining time
...
TC1
...
2
...
Pass
...
-
...
TC2
...
3
...
Not Applicable
...
-
...
TC3
...
4
...
Failed
...
4
...
TC4
...
5
...
Blocked
...
5
...
14
...
9
Execution Time = 14
Remaining Time = 9
Change Log
Read about Change Log
Import Issues
Sync Requirements and Issues from Jira
Export Issues
Export Issues to CSV Format /XLSX Format
| Child pages (Children Display) |
|---|