Requirement Report (5) (5)
Requirement report provides standard industry matrices used by Product Manager/Owners, Business Analysts, QA managers, Scrum Masters/Owners to get a summarized view on coverage and execution status for selected scope i.e combination of Project, Release and Cycle.
The report can be generated for multiple projects. You can select more than one project on the drop-down.
Only one Release and Cycle can be selected at a time.
- If only Project is selected (without Release and Cycle), then the latest version of requirement will be considered in the report.
- If Release/Cycle is selected along with Project, then the requirement version associated to that Release and Cycle will be considered in the report.
Requirement reports shows the following matrices:
- Requirement Coverage: The report shows summary of requirements by their coverage status based on test case linkages. Requirement is covered if it is linked to one or more testcases

- Requirement With Issues : The report shows the summary of requirements linked to issues. This report will count issues that are linked to requirements linked.

- Planned Requirements: The report shows summary of requirements Planned or Unplanned for execution. A requirement would be considered as planned once all the test cases linked to it are added to a Test suite.

- Requirement Summary: The report shows summary of requirements grouped by their workflow status / priority.

Filter Report:
Click on the Filter icon  on the individual chart to generate the report as per requirement by applying multiple filters.
Export Chart in CSV:
To export the individual chart, click on the cog icon on the chart and select Export.
Download the Chart
You can see the camera icon to to download the chart. The download functionality makes it easier for users to save charts as images with PNG format.
Zoom in the Bar Chart
You can zoom-in the chart view by just holding and dragging the mouse pointer to select a particular area on the chart. It enlarges that covered area on the chart and let you view more granular details. It gives you a closer look of the portion you selected on the chart.
As an alternative, you can use zoom in / zoom out icons.
Drill Down the Chart
You can view the tabular format of the graphical representation. Drill down the chart by clicking on the required portion/bar of the chart. It displays the details in table - rows and columns.
To download the report in CSV, click on the download icon at top right.
Then check the Scheduled Task section from where you can see the progress and download the report.
Schedule Emails to Send Reports
You can share updated reports on regular basis to stakeholders. QMetry offers the flexibility to schedule emails that will contain PDF of report details.
To schedule outbound emails at particular frequency, click on the Schedule button for the report that you want to share. The report details will be sent in PDF to recipients as per defined schedule.
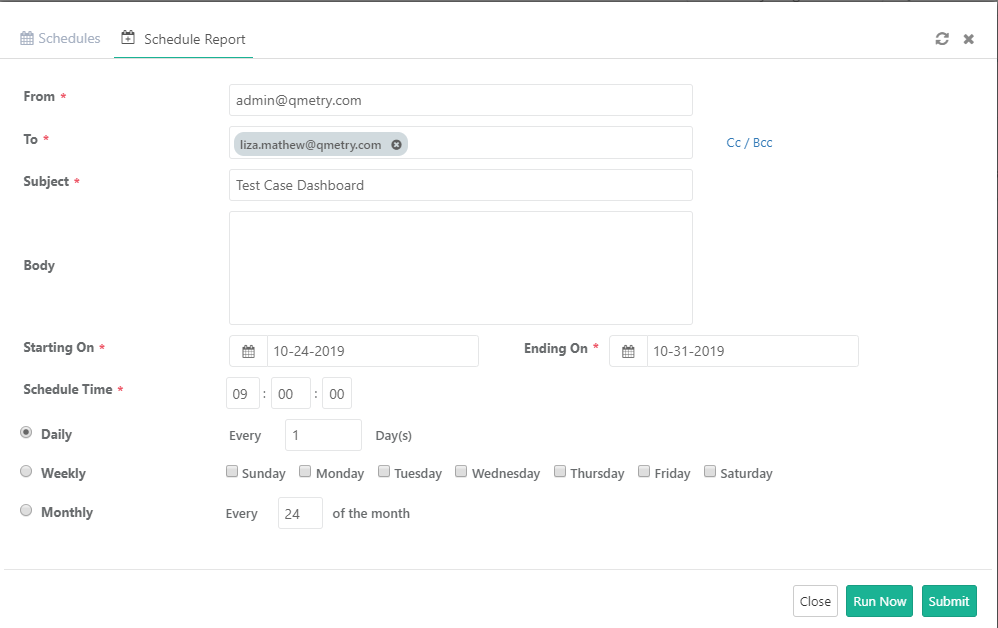
The Schedule icon turns green as soon as the email is scheduled.
Schedules: The Schedules tab is located adjacent to the Schedule Report tab. Click on the Schedules tab to view the history of scheduled reports.